Real Time Patterns (RTP)
- Set up pattern search criteria
- Receive patterns in your feed
Real-time pattern trading is a smart way to find entry and exit prices if you can scan thousands of stocks and ETFs within minutes. It is definitely impossible for humans. Artificial Intelligence (A.I.) not only discovers these patterns, but also checks if they worked out well in the past. Knowing the success rate in the past allows A.I. to establish the odds of success in the future.


Flag


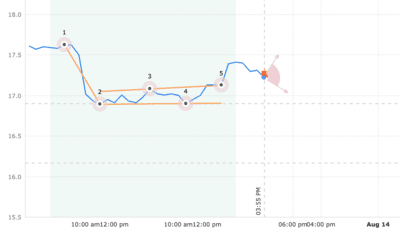
The Falling Flag (or Bearish Flag) pattern looks like a flag with the mast turned upside down (the mast points up). The pattern forms when falling prices experience a consolidation period, and the price moves within a narrow range defined by the parallel lines through points 2-4 and 3-5. After the consolidation, the previous trend resumes.
This type of formation happens when anticipation of a downtrend is high, and when a security’s price consolidates during a broader decline. It may indicate growing investor concern of an impending downtrend.
Trade idea
If the price breaks out from the bottom pattern boundary, day traders and swing traders should trade with a DOWN trend. Consider selling the security short or buying a put option at the downward breakout price level. The breakout price level for the Falling Flag pattern is the highest low reached within the pattern (4). To identify an exit, calculate the target price by subtracting the initial fall between points 1 and 2 from the breakout price. When trading, wait for the confirmation move, which is when the price falls below the breakout level.
To limit potential loss when price suddenly goes in the wrong direction, consider placing a stop order to buy back a short position or sell a put option at or above the breakout price.
Time frames No matter your trading strategy (day trading, swing, etc), we have patterns that will be ready to trade.
Flag (Bearish)
45.76 USD CURRENT PRICE
HWC - Hancock Whitney Corp.
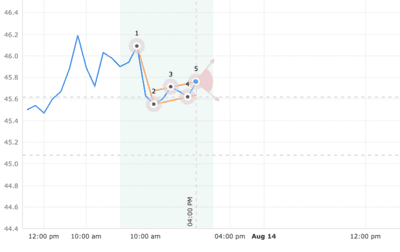
| STATUS | Emerged |
|---|---|
| CURRENT CONFIDENCE | 44% |
| TARGET (EXIT) PRICE | 45.62 USD |
| BREAKOUT (ENTRY) PRICE | 45.08 USD |
| DISTANCE TO TARGET PRICE | 1.49% |
| EMERGED ON | Aug 13, closing price |
| WITH CONFIDENCE LEVEL | 44% |
Statistics for ‘Flag‘
Flag (Bearish)
123.52 USD CURRENT PRICE
IBP - Installed Building Products Inc
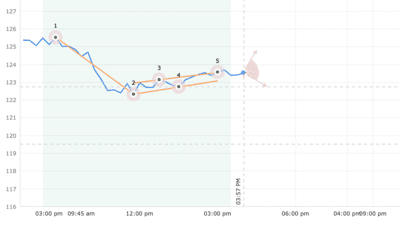
| STATUS | Emerged |
|---|---|
| CURRENT CONFIDENCE | 34% |
| TARGET (EXIT) PRICE | 122.73 USD |
| BREAKOUT (ENTRY) PRICE | 119.53 USD |
| DISTANCE TO TARGET PRICE | 3.23% |
| EMERGED ON | Aug 13, 03:00 PM (EDT) |
| WITH CONFIDENCE LEVEL | 37% |
Statistics for ‘Flag‘
Flag (Bearish)
4.60 USD CURRENT PRICE
PFMT - Performant Financial Corp
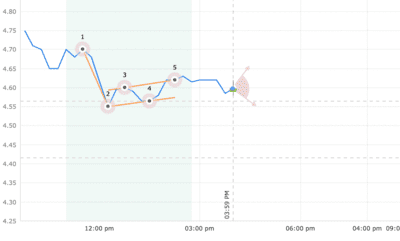
| STATUS | Emerged |
|---|---|
| CURRENT CONFIDENCE | 41% |
| TARGET (EXIT) PRICE | 4.57 USD |
| BREAKOUT (ENTRY) PRICE | 4.42 USD |
| DISTANCE TO TARGET PRICE | 3.95% |
| EMERGED ON | Aug 13, 02:15 PM (EDT) |
| WITH CONFIDENCE LEVEL | 45% |
Statistics for ‘Flag‘
Flag (Bearish)
198.52 USD CURRENT PRICE
FRC - First Republic Bank
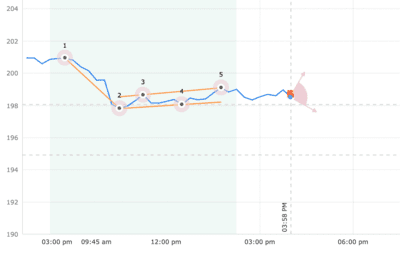
| STATUS | Emerged |
|---|---|
| CURRENT CONFIDENCE | 33% |
| TARGET (EXIT) PRICE | 198.05 USD |
| BREAKOUT (ENTRY) PRICE | 194.92 USD |
| DISTANCE TO TARGET PRICE | 1.81% |
| EMERGED ON | Aug 13, 01:45 PM (EDT) |
| WITH CONFIDENCE LEVEL | 40% |
Statistics for ‘Flag‘
Flag (Bearish)
17.22 USD CURRENT PRICE
QNST - QuinStreet Inc
| STATUS | Emerged |
|---|---|
| CURRENT CONFIDENCE | 36% |
| TARGET (EXIT) PRICE | 16.90 USD |
| BREAKOUT (ENTRY) PRICE | 16.17 USD |
| DISTANCE TO TARGET PRICE | 6.13% |
| EMERGED ON | Aug 13, 01:00 PM (EDT) |
| WITH CONFIDENCE LEVEL | 41% |