Real Time Patterns (RTP)
- Set up pattern search criteria
- Receive patterns in your feed
Real-time pattern trading is a smart way to find entry and exit prices if you can scan thousands of stocks and ETFs within minutes. It is definitely impossible for humans. Artificial Intelligence (A.I.) not only discovers these patterns, but also checks if they worked out well in the past. Knowing the success rate in the past allows A.I. to establish the odds of success in the future.


Broadening Top


The Broadening Top pattern forms when a security price makes higher highs (1, 3, 5) and lower lows (2, 4) following two widening trend lines. The price is expected to move up or down past the pattern depending on which line is broken first. What distinguishes a Broadening Top from a Broadening Bottom is that the price of the security is rising prior to entering the pattern formation.
This type of formation happens when volatility is high or increasing, and when a security’s price is moving with high volatility but little or no direction. It indicates growing investor nervousness and indecisiveness.
Trade Idea
If the price breaks out from the bottom pattern boundary, day traders and swing traders should trade with a DOWN trend. Consider selling the security short or buying a put option at the downward breakout price level. To identify an exit, compute the target price by subtracting the pattern height from breakout point. The pattern height is difference between the pattern’s highest high and its lowest low.
To limit potential loss when price suddenly goes in the wrong direction, consider placing a stop order to buy back a short position or sell a put option at or above the breakout price.
Time frames No matter your trading strategy (day trading, swing, etc), we have patterns that will be ready to trade.
Broadening Top (Bearish)
8.15 USD CURRENT PRICE
ZNGA - Zynga Inc - Ordinary Shares - Class A
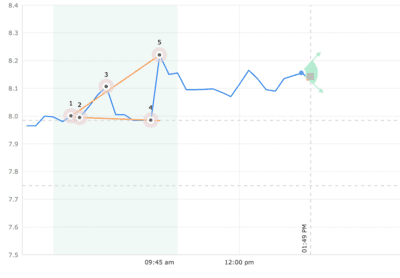
| STATUS | Emerged |
|---|---|
| CURRENT CONFIDENCE | 53% |
| TARGET (EXIT) PRICE | 7.99 USD |
| BREAKOUT (ENTRY) PRICE | 7.75 USD |
| DISTANCE TO TARGET PRICE | 4.85% |
| EMERGED ON | Aug 09, 09:45 AM (EDT) |
| WITH CONFIDENCE LEVEL | 60% |
Statistics for ‘Broadening Top‘
Broadening Top (Bearish)
80.86 USD CURRENT PRICE
LITE - Lumentum Holdings Inc
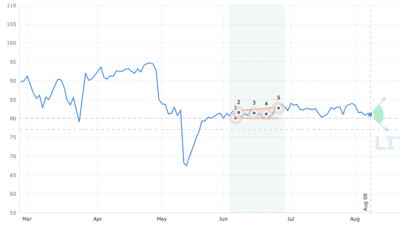
| STATUS | Emerged |
|---|---|
| CURRENT CONFIDENCE | 100% |
| TARGET (EXIT) PRICE | 80.02 USD |
| BREAKOUT (ENTRY) PRICE | 77.06 USD |
| DISTANCE TO TARGET PRICE | 4.69% |
| EMERGED ON | Jun 25, closing price |
| WITH CONFIDENCE LEVEL | 100% |
Statistics for ‘Broadening Top‘
Broadening Top (Bearish)
62.04 USD CURRENT PRICE
MTSI - MACOM Technology Solutions Holdings Inc
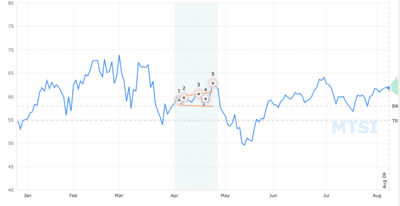
| STATUS | Emerged |
|---|---|
| CURRENT CONFIDENCE | 56% |
| TARGET (EXIT) PRICE | 57.93 USD |
| BREAKOUT (ENTRY) PRICE | 54.85 USD |
| DISTANCE TO TARGET PRICE | 11.58% |
| EMERGED ON | Apr 26, closing price |
| WITH CONFIDENCE LEVEL | 56% |
Statistics for ‘Broadening Top‘
Broadening Top (Bearish)
5,181.78 USD CURRENT PRICE
NVR - NVR Inc.
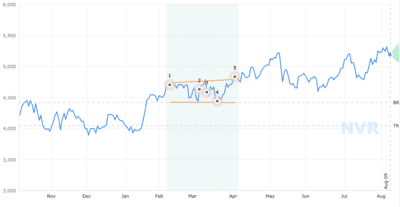
| STATUS | Emerged |
|---|---|
| CURRENT CONFIDENCE | 55% |
| TARGET (EXIT) PRICE | 4,418.81 USD |
| BREAKOUT (ENTRY) PRICE | 4,048.18 USD |
| DISTANCE TO TARGET PRICE | 21.88% |
| EMERGED ON | Apr 05, closing price |
| WITH CONFIDENCE LEVEL | 55% |
Statistics for ‘Broadening Top‘
Broadening Top (Bearish)
11.18 USD CURRENT PRICE
NFH - New Frontier Health Corporation - Ordinary Shares - Class A
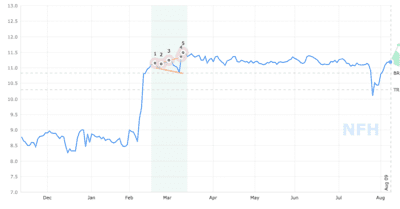
| STATUS | Emerged |
|---|---|
| CURRENT CONFIDENCE | 71% |
| TARGET (EXIT) PRICE | 10.83 USD |
| BREAKOUT (ENTRY) PRICE | 10.30 USD |
| DISTANCE TO TARGET PRICE | 7.87% |
| EMERGED ON | Mar 11, closing price |
| WITH CONFIDENCE LEVEL | 0% |