Real Time Patterns (RTP)
- Set up pattern search criteria
- Receive patterns in your feed
Real-time pattern trading is a smart way to find entry and exit prices if you can scan thousands of stocks and ETFs within minutes. It is definitely impossible for humans. Artificial Intelligence (A.I.) not only discovers these patterns, but also checks if they worked out well in the past. Knowing the success rate in the past allows A.I. to establish the odds of success in the future.


Head-and-Shoulders Bottom


The bullish head and shoulders is the opposite image of a bearish head and shoulders. It has all the same parts—two shoulders, a neckline, and the head. Only instead of the shoulders and head being formed at high points for the stock, they are formed at low points.
The investor psychology is the opposite of the bearish pattern. The stock is falling and hits a temporary low to form the left shoulder before a bounce occurs and forms the left side of the neck. The upward momentum is temporary and the next down leg takes the stock lower than the left shoulder and forms the head.
Investors jump in thinking the new low is a buying opportunity but then start taking profits after a decent run up to the neckline. The profit-taking creates the next down leg, but investors start buying on this third down leg before it gets down to the previous low. This forms the right shoulder and starts the next upward move.
Now, the momentum is to the upside and the buying pressure sends the stock above the neckline. At this point, the pattern is confirmed. After breaking above the neckline, the upward momentum is likely to continue and the stock price keeps moving higher.
With the drawings, the patterns are drawn perfectly symmetrical so they are easier to explain and recognize. However, on real charts the pattern is very rarely symmetrical. Sometimes the neckline will have a little slope to it and one shoulder may be a little lower or higher than the other.
Time frames No matter your trading strategy (day trading, swing, etc), we have patterns that will be ready to trade.
Head-and-Shoulders Bottom (Bullish)
22.47 USD CURRENT PRICE
NMM - Navios Maritime Partners L.P. - Unit
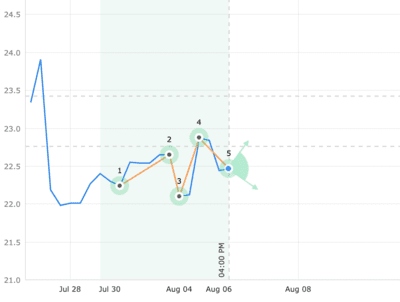
| STATUS | Emerged |
|---|---|
| CURRENT CONFIDENCE | 80% |
| TARGET (EXIT) PRICE | 23.42 USD |
| BREAKOUT (ENTRY) PRICE | 22.76 USD |
| DISTANCE TO TARGET PRICE | 4.25% |
| EMERGED ON | Aug 06, closing price |
| WITH CONFIDENCE LEVEL | 60% |
Statistics for ‘Head-and-Shoulders Bottom‘
Head-and-Shoulders Bottom (Bullish)
77.83 USD CURRENT PRICE
TCX - Tucows, Inc. - Ordinary Shares - Class A
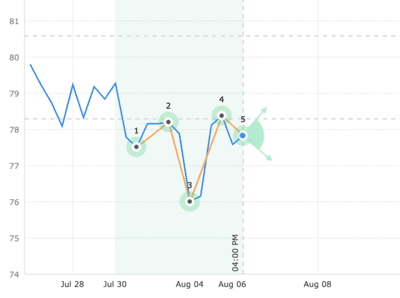
| STATUS | Emerged |
|---|---|
| CURRENT CONFIDENCE | 55% |
| TARGET (EXIT) PRICE | 80.58 USD |
| BREAKOUT (ENTRY) PRICE | 78.29 USD |
| DISTANCE TO TARGET PRICE | 3.53% |
| EMERGED ON | Aug 06, closing price |
| WITH CONFIDENCE LEVEL | 55% |
Statistics for ‘Head-and-Shoulders Bottom‘
Head-and-Shoulders Bottom (Bullish)
235.52 USD CURRENT PRICE
WDAY - Workday Inc - Ordinary Shares - Class A
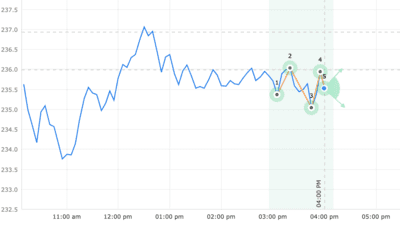
| STATUS | Emerged |
|---|---|
| CURRENT CONFIDENCE | 52% |
| TARGET (EXIT) PRICE | 236.93 USD |
| BREAKOUT (ENTRY) PRICE | 235.99 USD |
| DISTANCE TO TARGET PRICE | 0.60% |
| EMERGED ON | Aug 06, closing price |
| WITH CONFIDENCE LEVEL | 52% |
Statistics for ‘Head-and-Shoulders Bottom‘
Head-and-Shoulders Bottom (Bullish)
37.74 USD CURRENT PRICE
MLR - Miller Industries Inc.
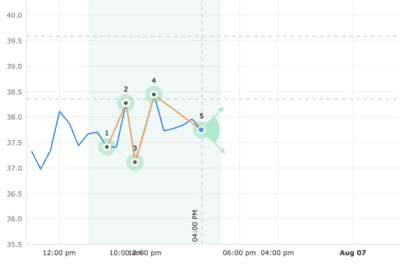
| STATUS | Emerged |
|---|---|
| CURRENT CONFIDENCE | 62% |
| TARGET (EXIT) PRICE | 39.59 USD |
| BREAKOUT (ENTRY) PRICE | 38.35 USD |
| DISTANCE TO TARGET PRICE | 4.90% |
| EMERGED ON | Aug 06, closing price |
| WITH CONFIDENCE LEVEL | 51% |