Real Time Patterns (RTP)
- Set up pattern search criteria
- Receive patterns in your feed
Real-time pattern trading is a smart way to find entry and exit prices if you can scan thousands of stocks and ETFs within minutes. It is definitely impossible for humans. Artificial Intelligence (A.I.) not only discovers these patterns, but also checks if they worked out well in the past. Knowing the success rate in the past allows A.I. to establish the odds of success in the future.


Broadening Wedge Descending


Once the price breaks out from the top pattern boundary, day traders and swing traders should trade with an UP trend. Consider buying a security or a call option at the upward breakout price level. To identify an exit, compute the target price for by adding the height of the pattern to the upward Breakout level. Pattern height is the difference between the highest high and the lowest low. The upward Breakout level is the highest high.
To limit potential loss when the price suddenly goes in the wrong direction, consider placing a stop order to sell at or below the breakout price.
The Broadening Wedge Descending pattern forms when the price of a security makes lower lows (1, 3, 5) and lower highs (2, 4), forming a downtrend. This pattern may form when large investors spread out their selling over a period of time.
When the initial selling occurs, other market participants react to the falling price and jump on the bandwagon to participate. Then the value investors begin to buy, believing the price has fallen too much, which also spurs the original large investor to resume buying again as well.
Time frames No matter your trading strategy (day trading, swing, etc), we have patterns that will be ready to trade.
Broadening Wedge Descending (Bullish)
64.60 USD CURRENT PRICE
TPTX - Turning Point Therapeutics Inc
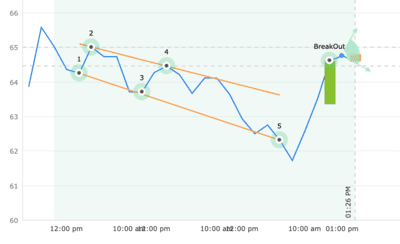
| STATUS | Confirmed |
|---|---|
| CURRENT CONFIDENCE | 68% |
| TARGET (EXIT) PRICE | 65.01 USD |
| BREAKOUT (ENTRY) PRICE | 64.46 USD |
| DISTANCE TO TARGET PRICE | 0.63% |
| CONFIRMED ON | Aug 05, 11:59 AM (EDT) |
| EMERGED ON | Aug 04, 03:00 PM (EDT) |
| WITH CONFIDENCE LEVEL | 72% |
Statistics for ‘Broadening Wedge Descending‘
Broadening Wedge Descending (Bullish)
35.00 USD CURRENT PRICE
CLR - Continental Resources Inc (OKLA)
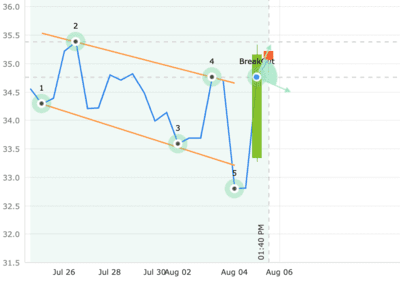
| STATUS | Confirmed |
|---|---|
| CURRENT CONFIDENCE | 73% |
| TARGET (EXIT) PRICE | 35.38 USD |
| BREAKOUT (ENTRY) PRICE | 34.76 USD |
| DISTANCE TO TARGET PRICE | 1.09% |
| CONFIRMED ON | Aug 05, 10:25 AM (EDT) ) |
| EMERGED ON | Aug 04, 12:00 PM (EDT) |
| WITH CONFIDENCE LEVEL | 76% |
Statistics for ‘Broadening Wedge Descending‘
Broadening Wedge Descending (Bullish)
7.23 USD CURRENT PRICE
CRIS - Curis Inc
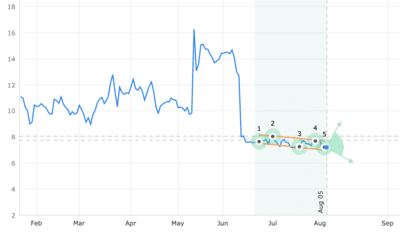
| STATUS | Emerged |
|---|---|
| CURRENT CONFIDENCE | 67% |
| TARGET (EXIT) PRICE | 8.07 USD |
| BREAKOUT (ENTRY) PRICE | 7.77 USD |
| DISTANCE TO TARGET PRICE | 12.24% |
| EMERGED ON | Aug 04, closing price |
| WITH CONFIDENCE LEVEL | 76% |
Statistics for ‘Broadening Wedge Descending‘
Broadening Wedge Descending (Bullish)
6.54 USD CURRENT PRICE
HTBX - Heat Biologics Inc
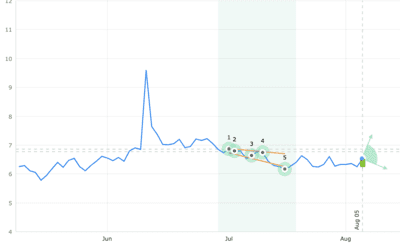
| STATUS | Emerged |
|---|---|
| CURRENT CONFIDENCE | 75% |
| TARGET (EXIT) PRICE | 6.86 USD |
| BREAKOUT (ENTRY) PRICE | 6.77 USD |
| DISTANCE TO TARGET PRICE | 4.89% |
| EMERGED ON | Jul 16, closing price |
| WITH CONFIDENCE LEVEL | 74% |
Statistics for ‘Broadening Wedge Descending‘
Broadening Wedge Descending (Bullish)
21.34 USD CURRENT PRICE
CEIX - Consol Energy Inc
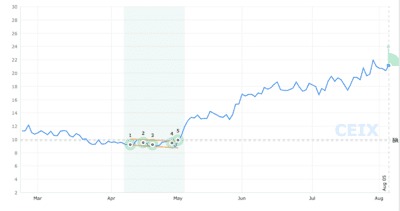
| STATUS | Emerged |
|---|---|
| CURRENT CONFIDENCE | 100% |
| TARGET (EXIT) PRICE | 9.98 USD |
| BREAKOUT (ENTRY) PRICE | 9.79 USD |
| DISTANCE TO TARGET PRICE | Target reached |
| EMERGED ON | May 03, closing price |
| WITH CONFIDENCE LEVEL | 100% |