Real Time Patterns (RTP)
- Set up pattern search criteria
- Receive patterns in your feed
Real-time pattern trading is a smart way to find entry and exit prices if you can scan thousands of stocks and ETFs within minutes. It is definitely impossible for humans. Artificial Intelligence (A.I.) not only discovers these patterns, but also checks if they worked out well in the past. Knowing the success rate in the past allows A.I. to establish the odds of success in the future.


Rectangle Top


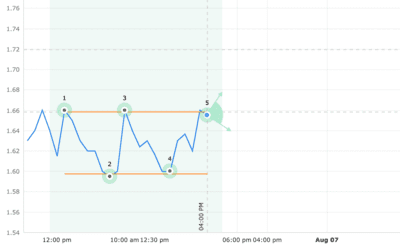
The Rectangle Top pattern forms when the price of a security is stuck in a range bound motion. Two horizontal lines (top: 1, 3, 5) and (bottom: 2, 4) form the pattern as the security bounces up and down between support and resistance levels. Depending on who gives up first buyers or sellers the price can breakout in either direction.
This pattern is commonly associated with directionless markets. Usually the pattern performs better when there is a strong uptrend leading into the formation.
Trade idea
If the price breaks out from the top pattern boundary, day traders and swing traders should trade with an UP trend. Consider buying a security or a call option at the breakout price level. To identify an exit, compute the target price level by adding the pattern height (which is the distance between the horizontal line (from top to bottom) and add it from the breakout price.
To limit potential loss when price suddenly goes in the wrong direction, consider placing a stop order to sell at or below the breakout price.
Time frames No matter your trading strategy (day trading, swing, etc), we have patterns that will be ready to trade.
Rectangle Top (Bullish)
52.54 USD CURRENT PRICE
SAH - Sonic Automotive, Inc. - Ordinary Shares - Class A
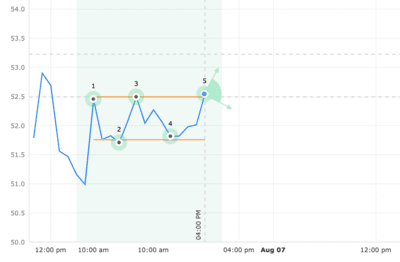
| STATUS | Emerged |
|---|---|
| CURRENT CONFIDENCE | 68% |
| TARGET (EXIT) PRICE | 53.23 USD |
| BREAKOUT (ENTRY) PRICE | 52.49 USD |
| DISTANCE TO TARGET PRICE | 1.31% |
| EMERGED ON | Aug 06, closing price |
| WITH CONFIDENCE LEVEL | 68% |
Statistics for ‘Rectangle Top‘
Rectangle Top (Bullish)
148.54 USD CURRENT PRICE
PRI - Primerica Inc
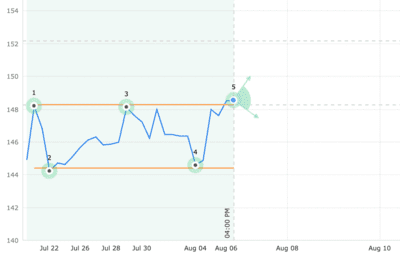
| STATUS | Emerged |
|---|---|
| CURRENT CONFIDENCE | 60% |
| TARGET (EXIT) PRICE | 152.15 USD |
| BREAKOUT (ENTRY) PRICE | 148.28 USD |
| DISTANCE TO TARGET PRICE | 2.43% |
| EMERGED ON | Aug 06, closing price |
| WITH CONFIDENCE LEVEL | 60% |
Statistics for ‘Rectangle Top‘
Rectangle Top (Bullish)
100.68 USD CURRENT PRICE
MXIM - Maxim Integrated Products, Inc.
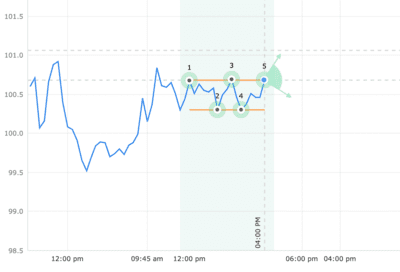
| STATUS | Emerged |
|---|---|
| CURRENT CONFIDENCE | 64% |
| TARGET (EXIT) PRICE | 101.06 USD |
| BREAKOUT (ENTRY) PRICE | 100.68 USD |
| DISTANCE TO TARGET PRICE | 0.83% |
| EMERGED ON | Aug 06, closing price |
| WITH CONFIDENCE LEVEL | 64% |
Statistics for ‘Rectangle Top‘
Rectangle Top (Bullish)
2.60 USD CURRENT PRICE
CKPT - Checkpoint Therapeutics Inc
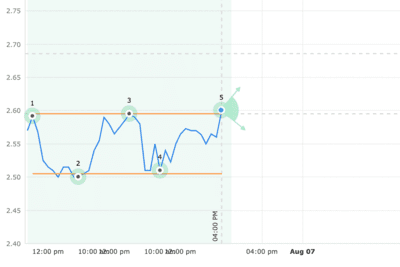
| STATUS | Emerged |
|---|---|
| CURRENT CONFIDENCE | 55% |
| TARGET (EXIT) PRICE | 02.69 USD |
| BREAKOUT (ENTRY) PRICE | 2.60 USD |
| DISTANCE TO TARGET PRICE | 3.30% |
| EMERGED ON | Aug 06, closing price |
| WITH CONFIDENCE LEVEL | 55% |
Statistics for ‘Rectangle Top‘
Rectangle Top (Bullish)
1.66 USD CURRENT PRICE
TGA - Transglobe Energy Corp.
| STATUS | Emerged |
|---|---|
| CURRENT CONFIDENCE | 62% |
| TARGET (EXIT) PRICE | 1.72 USD |
| BREAKOUT (ENTRY) PRICE | 1.66 USD |
| DISTANCE TO TARGET PRICE | 3.88% |
| EMERGED ON | Aug 06, closing price |
| WITH CONFIDENCE LEVEL | 62% |