Screener of Stock Bullish Head-and-Shoulders Bottom
AI Pattern Search Engine (PSE)
Operating the Pattern Search Engine is easy and straightforward
- Set up pattern search criteria
- Receive patterns in your feed
- Bookmark patterns to track their status
How It Works
Trading patterns is one of the most sophisticated trading strategies. It exploits the psychology of market participants, and takes advantage of the knowledge of market insights.If you want to use AI to discover these hidden effects, then Tickeron’s Pattern Search Engine is the tool you need. Using PSE, AI will teach you to recognize patterns and entry and exit points.
Pattern Types and Stats


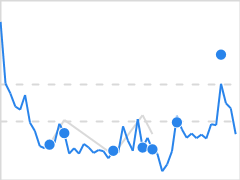
Head-and-Shoulders Bottom


The bullish head and shoulders is the opposite image of a bearish head and shoulders. It has all the same parts—two shoulders, a neckline, and the head. Only instead of the shoulders and head being formed at high points for the stock, they are formed at low points.
The investor psychology is the opposite of the bearish pattern. The stock is falling and hits a temporary low to form the left shoulder before a bounce occurs and forms the left side of the neck. The upward momentum is temporary and the next down leg takes the stock lower than the left shoulder and forms the head.
Investors jump in thinking the new low is a buying opportunity but then start taking profits after a decent run up to the neckline. The profit-taking creates the next down leg, but investors start buying on this third down leg before it gets down to the previous low. This forms the right shoulder and starts the next upward move.
Now, the momentum is to the upside and the buying pressure sends the stock above the neckline. At this point, the pattern is confirmed. After breaking above the neckline, the upward momentum is likely to continue and the stock price keeps moving higher.
With the drawings, the patterns are drawn perfectly symmetrical so they are easier to explain and recognize. However, on real charts the pattern is very rarely symmetrical. Sometimes the neckline will have a little slope to it and one shoulder may be a little lower or higher than the other.