Screener of Stock Bullish Broadening Wedge Ascending
AI Pattern Search Engine (PSE)
Operating the Pattern Search Engine is easy and straightforward
- Set up pattern search criteria
- Receive patterns in your feed
- Bookmark patterns to track their status
How It Works
Trading patterns is one of the most sophisticated trading strategies. It exploits the psychology of market participants, and takes advantage of the knowledge of market insights.If you want to use AI to discover these hidden effects, then Tickeron’s Pattern Search Engine is the tool you need. Using PSE, AI will teach you to recognize patterns and entry and exit points.
Pattern Types and Stats


Broadening Wedge Ascending


Once the price breaks out from the top pattern boundary, day traders and swing traders should trade with an UP trend. Consider buying a security or a call option at the upward breakout price/entry point. To identify an exit, compute the target price for this formation by adding the height of the pattern to the upward breakout level. Pattern height is the difference between the breakout price (the highest high within the pattern) and the highest low.
To limit potential loss when the price suddenly goes in the wrong direction, consider placing a stop order to sell at or below the breakout price.
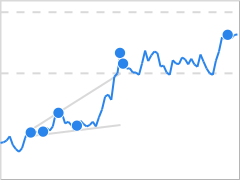
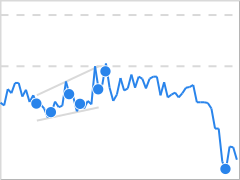
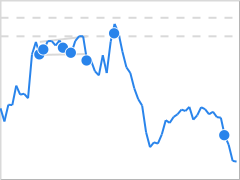
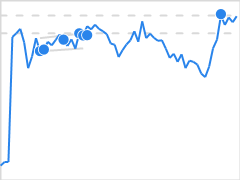
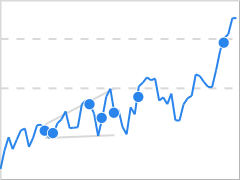
The Broadening Wedge Ascending pattern forms when the price of a security progressively makes higher highs (1, 3) and higher lows (2, 4), following two widening trend lines. This pattern may form when large investors spread their buying over a period of time.
The theory goes that after initial buying occurs, other market participants react to the rising price and jump on the bandwagon to participate. Then value investors begin to sell, believing the price has risen too much, which spurs the original large investor to resume buying again. Once these activities stop, the price may break out in either direction.