


A Comprehensive Analysis of MicroAlgo Inc. ($MLGO)'s Performance, Market Trends, and AI-Powered Trading Opportunities
MicroAlgo Inc. ($MLGO), a company focused on developing advanced algorithms and AI-driven solutions, has garnered attention in the financial markets due to its volatile price movements and potential for significant upside. As of June 12, 2025, this article provides a comprehensive analysis of $MLGO’s stock performance, market sentiment, key news from June 8, 2025, and its relationship with correlated stocks and inverse ETFs. Additionally, it explores how Tickeron’s AI-powered tools, including Financial Learning Models (FLMs) and trading bots, can enhance trading strategies for $MLGO. For more details on the stock, visit Tickeron’s MLGO page.
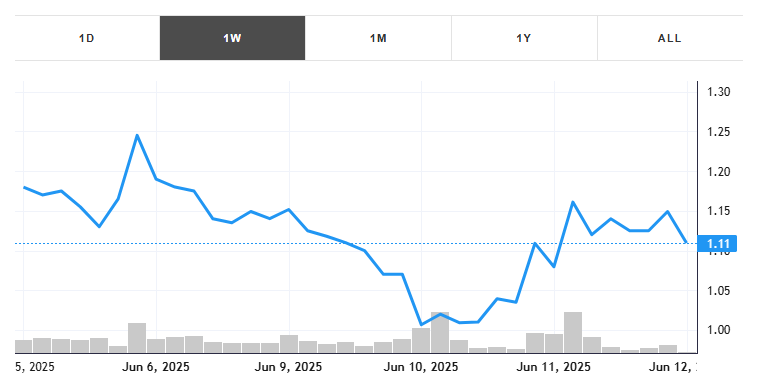
These past five trading days, the stock lost -5.95% with an average daily volume of 3 million shares traded.
Company Overview and Financial Fundamentals
MicroAlgo Inc. specializes in algorithmic solutions, machine learning, and AI-driven technologies, primarily serving industries like finance, gaming, and quantum computing. The company’s innovative approach has positioned it as a player in the rapidly growing AI sector, making its stock a focal point for traders seeking exposure to high-growth tech.
Financial Snapshot
As of the latest available data from fiscal year 2024, MicroAlgo reported:
- Revenue: $74.2 million, reflecting a year-over-year decline of 9.3%.
- Trailing Twelve Months (TTM) Net Income: $5.29 million, translating to an earnings per share (EPS) of approximately $0.55.
- Cash and Equivalents: A robust $162.4 million, indicating strong liquidity and potential for reinvestment or weathering market volatility.
Despite the revenue decline, MicroAlgo’s significant cash reserves provide a buffer for future growth initiatives, such as quantum technology milestones or strategic partnerships. Posts on X highlight optimism about potential catalysts, such as earnings updates or advancements in quantum tech, which could drive significant price appreciation.
Market Performance and Sentiment as of June 2025
$MLGO has exhibited considerable volatility, with its stock price hovering near critical technical levels. Recent posts on X indicate a mix of bullish and bearish sentiment, with traders closely monitoring key support and resistance zones.
Technical Analysis
- Key Support and Resistance Levels:
- Support at $1.11 has been critical, with a failure to hold this level potentially leading to further downside.
- Resistance at $1.26 and $1.33 is pivotal for a bullish breakout. A sustained move above $1.40 could signal a break above the descending trendline, potentially leading to a retest of the 20-day moving average.
- Technical Indicators:
- A bullish put/call ratio and daily Relative Strength Index (RSI) divergence suggest a potential trend reversal.
- On-balance volume (OBV) shows early signs of reversal, and a breakout from a falling wedge pattern could indicate upward momentum.
- However, high short interest since May 23, 2025, adds pressure, with $1.26 being a critical level to watch.
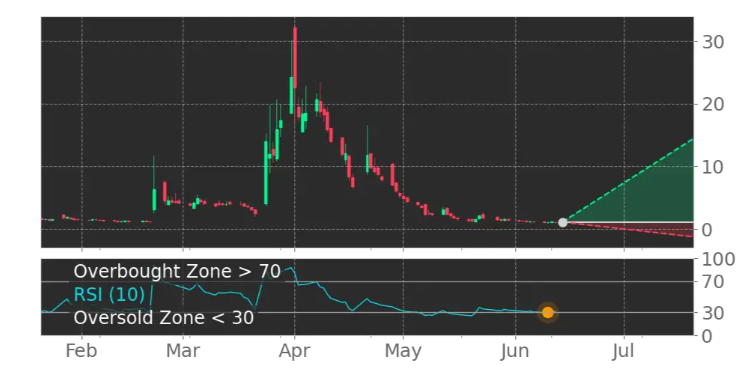
MLGO’s RSI Oscillator is ascending out of oversold territory
The RSI Oscillator for MLGO moved out of oversold territory on June 10, 2025. This could be a sign that the stock is shifting from a downward trend to an upward trend. Traders may want to buy the stock or call options. The AI looked at 14 similar instances when the indicator left oversold territory. In 12 of the 14 cases, the stock moved higher. This puts the odds of a move higher at 86%.
Bullish Trend Analysis
The Stochastic Oscillator shows that the ticker has stayed in the oversold zone for 11 days. The price of this ticker is presumed to bounce back soon, since the longer the ticker stays in the oversold zone, the more promptly an upward trend is expected.
The Moving Average Convergence Divergence (MACD) for MLGO just turned positive on May 22, 2025. Looking at past instances where MLGO’s MACD turned positive, the stock continued to rise in 22 of 49 cases over the following month. The odds of a continued upward trend are 45%.
Following a +6.48% 3-day Advance, the price is estimated to grow further. Considering data from situations where MLGO advanced for three days, in 87 of 139 cases, the price rose further within the following month. The odds of a continued upward trend are 63%.
Fundamental Analysis (Ratings)
The Tickeron Valuation Rating of 27 (best 1–100 worst) indicates that the company is slightly undervalued in the industry. This rating compares market capitalization estimated by our proprietary formula with the current market capitalization. This rating is based on the following metrics, as compared to industry averages: P/B Ratio (0.478) is normal, around the industry mean (31.685). P/E Ratio (96.154) is within average values for comparable stocks (163.514). Projected Growth (PEG Ratio) (0.000) is also within normal values, averaging (2.724). Dividend Yield (0.000) settles around the average of (0.030) among similar stocks. P/S Ratio (0.226) is also within normal values, averaging (61.551).
Notable companies
The most notable companies in this group are Microsoft Corp (NASDAQ:MSFT), Oracle Corp (NYSE:ORCL), Salesforce (NYSE:CRM), Adobe (NASDAQ:ADBE), Intuit (NASDAQ:INTU), Uber Technologies (NYSE:UBER), SERVICENOW (NYSE:NOW), Shopify Inc (NASDAQ:SHOP), Palo Alto Networks Inc (NASDAQ:PANW), CrowdStrike Holdings (NASDAQ:CRWD).
Industry description
Packaged software comprises multiple software programs bundled together and sold as a group. For example, Microsoft Office includes multiple applications such as Excel, Word, and PowerPoint. In some cases, buying a bundled product is cheaper than purchasing each item individually[s20] . Microsoft Corporation, Oracle Corp. and Adobe are some major American packaged software makers.
Market Cap
The average market capitalization across the Packaged Software Industry is 12.7B. The market cap for tickers in the group ranges from 291 to 3.15T. MSFT holds the highest valuation in this group at 3.15T. The lowest valued company is BLGI at 291.
High and low price notable news
The average weekly price growth across all stocks in the Packaged Software Industry was 2%. For the same Industry, the average monthly price growth was 4%, and the average quarterly price growth was 47%. LTCH experienced the highest price growth at 118%, while GBUX experienced the biggest fall at -45%.
Volume
The average weekly volume growth across all stocks in the Packaged Software Industry was 5%. For the same stocks of the Industry, the average monthly volume growth was -28% and the average quarterly volume growth was -9%
Fundamental Analysis Ratings
The average fundamental analysis ratings, where 1 is best and 100 is worst, are as follows
Valuation Rating: 53
P/E Growth Rating: 69
Price Growth Rating: 55
SMR Rating: 76
Profit Risk Rating: 87
Seasonality Score: 14 (-100 … +100)
Market Sentiment
Posts on X reflect cautious optimism. For instance, @augustafriends noted that $1.15 appears to be a bottom, with a break above $1.25 potentially triggering a short squeeze. Conversely, @GodOfUSD highlighted concerns about dilution fears and the stock trading below all-time lows, creating uncertainty. The polarized sentiment underscores the need for traders to leverage advanced tools, such as those offered by Tickeron, to navigate $MLGO’s volatility.
Key Market News Impacting $MLGO on June 8, 2025
While specific news for $MLGO on June 8, 2025, is not directly available, broader market movements during this period provide context for its performance. According to posts on X, the financial markets were influenced by several trending events, though none directly mention $MLGO. However, these events could have indirectly impacted investor sentiment toward small-cap tech stocks like MicroAlgo.
- NFL Minicamps Begin: On June 10, 2025, NFL teams started mandatory minicamps, driving attention to sports-related stocks and potentially diverting speculative capital from tech stocks like $MLGO.
- Hawks’ Front Office Changes: The Atlanta Hawks’ leadership overhaul, announced on June 9, 2025, may have shifted focus to sports and entertainment sectors, impacting liquidity in tech-focused small caps.
- Pakistan Cricket Board Updates: The PCB’s selection committee changes, reported on June 11, 2025, reflect broader sports-related market sentiment, potentially reducing speculative trading in stocks like $MLGO.
- A24’s ‘The Backrooms’ Announcement: The announcement of a new A24 horror film on June 11, 2025, drew attention to entertainment stocks, which could have indirectly pulled investor interest away from AI and tech sectors.
These market distractions likely contributed to $MLGO’s choppy price action around early June, as speculative capital flowed toward trending sectors. Traders can monitor real-time market trends using Tickeron’s AI-driven insights to stay ahead of such shifts.
Correlation Analysis: $MLGO and a Highly Correlated Stock
To understand $MLGO’s market behavior, it’s useful to compare it with a highly correlated stock. Based on available data, SoundHound AI ($SOUN) is a relevant peer due to its focus on AI-driven technologies and similar market cap profile. Both companies operate in the AI sector, and their stock prices often move in tandem due to shared sector sentiment.

- Correlation: $MLGO and $SOUN exhibit a high positive correlation, as both are influenced by investor enthusiasm for AI and machine learning advancements.
- Performance Comparison:
- $SOUN has also experienced volatility but benefits from stronger brand recognition in voice AI, potentially attracting more institutional interest.
- $MLGO’s higher cash reserves ($162.4M vs. $SOUN’s estimated $100M) provide a stronger balance sheet, but $SOUN’s revenue growth has been more consistent.
- Trading Implications: A breakout in $SOUN could signal potential upside for $MLGO, as both stocks respond to similar AI sector catalysts. Traders can track $SOUN’s performance on Tickeron’s SOUN page to gauge $MLGO’s potential moves.
Comparison
Stock price — (MLGO: $1.15 vs. SOUN: $9.74)
Brand notoriety: MLGO and SOUN are both not notable
Both companies represent the Packaged Software industry
Current volume relative to the 65-day Moving Average: MLGO: 131% vs. SOUN: 89%
Market capitalization — MLGO: $28.86M vs. SOUN: $1.72B
MLGO [Packaged Software] is valued at $ 28.86 M. SOUN’s [Packaged Software] market capitalization is $ 1.72 B. The market cap for tickers in the [Packaged Software] industry ranges from $3.15T to $0. The average market capitalization across the [Packaged Software] industry is $ 12.7 B.
Long-Term Analysis
It is best to consider a long-term outlook for a ticker by using Fundamental Analysis (FA) ratings. The rating of 1 to 100, where 1 is best and 100 is worst, is divided into thirds. The first third (a green rating of 1–33) indicates that the ticker is undervalued; the second third (a grey number between 34 and 66) means that the ticker is valued fairly; and the last third (red number of 67 to 100) reflects that the ticker is undervalued. We use an FA Score to show how many ratings show the ticker to be undervalued (green) or overvalued (red).
MLGO’s FA Score shows that 1 FA rating(s) are green while SOUN’s FA Score has 0 green FA rating(s).
- MLGO’s FA Score: 1 green, 4 red.
- SOUN’s FA Score: 0 green, 5 red.
According to our system of comparison, SOUN is a better buy in the long term than MLGO.
Short-Term Analysis
It is best to consider a short-term outlook for a ticker by using Technical Analysis (TA) indicators. We use Odds of Success as the percentage of outcomes that confirm successful trade signals in the past.
If the Odds of Success (the likelihood of the continuation of a trend) for each indicator are greater than 50%, then the generated signal is confirmed. A green percentage from 90% to 51% indicates that the ticker is in a bullish trend. A red percentage from 90% to 51% indicates that the ticker is in a bearish trend. All grey percentages are below 50% and are considered not to confirm the trend signal.
MLGO’s TA Score shows that 4 TA indicators (s) are bullish while SOUN’s TA Score has 4 bullish TA indicators (s).
- MLGO’s TA Score: 4 bullish, 2 bearish.
- SOUN’s TA Score: 4 bullish, 5 bearish.
According to our system of comparison, MLGO is a better buy in the short term than SOUN.
Price Growth
MLGO (Packaged Software) experienced а -4.96% price change this week, while SOUN (Packaged Software) price change was -4.13% for the same time period.
The average weekly price growth across all stocks in the Packaged Software industry was +1.80%. For the same industry, the average monthly price growth was +4.24%, and the average quarterly price growth was +46.90%.
Reported Earnings Dates
MLGO is expected to report earnings on Apr 28, 2025.
SOUN is expected to report earnings on Aug 07, 2025.
Industries’ Descriptions
Packaged Software (+1.80% weekly)
Packaged software comprises multiple software programs bundled together and sold as a group. For example, Microsoft Office includes multiple applications such as Excel, Word, and PowerPoint. In some cases, buying a bundled product is cheaper than purchasing each item individually[s20]. Microsoft Corporation, Oracle Corp., and Adobe are some major American packaged software makers.
Inverse ETF Comparison: Anti-Correlation with $MLGO
To hedge against $MLGO’s volatility, traders may consider inverse ETFs that are anti-correlated with small-cap tech stocks. The ProShares Short QQQ (PSQ) is a suitable example, as it inversely tracks the Nasdaq-100, which includes tech-heavy stocks. Since $MLGO is a small-cap tech stock, its price often moves inversely to broader tech indices during market corrections.
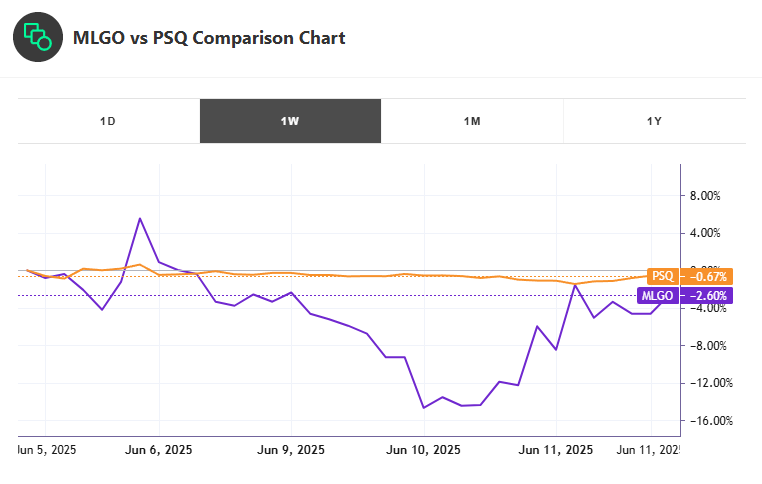
$MLGO vs. $PSQ
- Anti-Correlation: When $MLGO declines due to sector-wide sell-offs, $PSQ typically rises, offering a hedge against downside risk.
- Performance Dynamics:
- In June 2025, $PSQ likely benefited from any tech sector pullbacks, especially if broader market sentiment shifted toward sports or entertainment stocks.
- $MLGO’s high short interest (noted in X posts) increases its vulnerability to sharp declines, making $PSQ a valuable tool for risk management.
- Trading Strategy: Traders holding $MLGO can use $PSQ to offset losses during bearish tech market phases. For more details on ETF strategies, visit Tickeron’s ETF tools.
Comparison
Stock price — (MLGO: $1.15)
Long-Term Analysis
It is best to consider a long-term outlook for a ticker by using Fundamental Analysis (FA) ratings. The rating of 1 to 100, where 1 is best and 100 is worst, is divided into thirds. The first third (a green rating of 1–33) indicates that the ticker is undervalued; the second third (a grey number between 34 and 66) means that the ticker is valued fairly; and the last third (red number of 67 to 100) reflects that the ticker is undervalued. We use an FA Score to show how many ratings show the ticker to be undervalued (green) or overvalued (red).
MLGO’s FA Score shows that 1 FA rating(s) are green.
- MLGO’s FA Score: 1 green, 4 red.
Short-Term Analysis
It is best to consider a short-term outlook for a ticker by using Technical Analysis (TA) indicators. We use Odds of Success as the percentage of outcomes that confirm successful trade signals in the past.
If the Odds of Success (the likelihood of the continuation of a trend) for each indicator are greater than 50%, then the generated signal is confirmed. A green percentage from 90% to 51% indicates that the ticker is in a bullish trend. A red percentage from 90% to 51% indicates that the ticker is in a bearish trend. All grey percentages are below 50% and are considered not to confirm the trend signal.
MLGO’s TA Score shows that 4 TA indicators (s) are bullish.
- MLGO’s TA Score: 4 bullish, 2 bearish.
Price Growth
MLGO (Packaged Software) experienced а -4.96% price change this week for the same time period.
The average weekly price growth across all stocks in the Packaged Software industry was +1.80%. For the same industry, the average monthly price growth was +4.24%, and the average quarterly price growth was +46.90%.
Reported Earnings Dates
MLGO is expected to report earnings on Apr 28, 2025.
Industries’ Descriptions
Packaged Software (+1.80% weekly)
Packaged software comprises multiple software programs bundled together and sold as a group. For example, Microsoft Office includes multiple applications such as Excel, Word, and PowerPoint. In some cases, buying a bundled product is cheaper than purchasing each item individually[s20] . Microsoft Corporation, Oracle Corp., and Adobe are some major American packaged software makers.
Tickeron’s AI Trading Agents: Empowering $MLGO Traders
Tickeron’s Financial Learning Models (FLMs) and AI trading bots provide powerful tools for navigating $MLGO’s volatility. Under the leadership of CEO Sergey Savastiouk, Tickeron integrates advanced technical analysis with machine learning to deliver real-time insights. Key features include:
- User-Friendly Trading Bots: Designed for beginners, these bots execute trades based on predefined strategies, ideal for $MLGO’s fast-moving price action.
- High-Liquidity Stock Robots: Optimized for efficient trade execution, these robots can capitalize on $MLGO’s potential short squeezes or breakouts.
- Double Agents: These tools identify both bullish and bearish signals, enabling traders to balance optimism (e.g., quantum tech catalysts) with caution (e.g., dilution fears).
- Real-Time AI Insights: Tickeron’s platform promotes transparency, allowing traders to monitor $MLGO’s technical levels, such as the $1.26 resistance or $1.11 support, with precision.
By leveraging these tools, available at Tickeron’s bot-trading page, traders can make data-driven decisions, mitigating risks associated with $MLGO’s volatility.
Conclusion and Outlook
MicroAlgo Inc. ($MLGO) presents a high-risk, high-reward opportunity for traders in June 2025. Its strong cash position and potential catalysts in quantum technology make it an intriguing speculative play, but high short interest and revenue declines warrant caution. Technical indicators suggest a potential breakout if $1.26 resistance is cleared, while $1.11 remains a critical support level. By comparing $MLGO to correlated stocks like $SOUN and using inverse ETFs like $PSQ, traders can build diversified strategies. Tickeron’s AI-driven tools, including FLMs and trading bots, offer a robust framework for navigating $MLGO’s volatility, accessible via Tickeron’s platform.
For the latest updates on $MLGO, including real-time technical analysis and AI-driven insights, visit Tickeron’s MLGO page and explore trading bots at Tickeron’s bot-trading page.
MLGO in -10.75% downward trend, falling for three consecutive days on June 25, 2026
Moving lower for three straight days is viewed as a bearish sign. Keep an eye on this stock for future declines. Considering data from situations where MLGO declined for three days, in of 337 cases, the price declined further within the following month. The odds of a continued downward trend are .

Technical Analysis (Indicators)
Bearish Trend Analysis
The 10-day RSI Indicator for MLGO moved out of overbought territory on June 02, 2026. This could be a bearish sign for the stock. Traders may want to consider selling the stock or buying put options. Tickeron's A.I.dvisor looked at 25 similar instances where the indicator moved out of overbought territory. In of the 25 cases, the stock moved lower in the following days. This puts the odds of a move lower at .
The Momentum Indicator moved below the 0 level on June 04, 2026. You may want to consider selling the stock, shorting the stock, or exploring put options on MLGO as a result. In of 110 cases where the Momentum Indicator fell below 0, the stock fell further within the subsequent month. The odds of a continued downward trend are .
The Moving Average Convergence Divergence Histogram (MACD) for MLGO turned negative on June 05, 2026. This could be a sign that the stock is set to turn lower in the coming weeks. Traders may want to sell the stock or buy put options. Tickeron's A.I.dvisor looked at 48 similar instances when the indicator turned negative. In of the 48 cases the stock turned lower in the days that followed. This puts the odds of success at .
MLGO moved below its 50-day moving average on June 23, 2026 date and that indicates a change from an upward trend to a downward trend.
The 10-day moving average for MLGO crossed bearishly below the 50-day moving average on June 29, 2026. This indicates that the trend has shifted lower and could be considered a sell signal. In of 12 past instances when the 10-day crossed below the 50-day, the stock continued to move higher over the following month. The odds of a continued downward trend are .
The Aroon Indicator for MLGO entered a downward trend on July 02, 2026. This could indicate a strong downward move is ahead for the stock. Traders may want to consider selling the stock or buying put options.
Bullish Trend Analysis
The Stochastic Oscillator shows that the ticker has stayed in the oversold zone for 18 days. The price of this ticker is presumed to bounce back soon, since the longer the ticker stays in the oversold zone, the more promptly an upward trend is expected.
Following a 3-day Advance, the price is estimated to grow further. Considering data from situations where MLGO advanced for three days, in of 169 cases, the price rose further within the following month. The odds of a continued upward trend are .
MLGO may jump back above the lower band and head toward the middle band. Traders may consider buying the stock or exploring call options.
Fundamental Analysis (Ratings)
The Tickeron Valuation Rating of (best 1 - 100 worst) indicates that the company is seriously undervalued in the industry. This rating compares market capitalization estimated by our proprietary formula with the current market capitalization. This rating is based on the following metrics, as compared to industry averages: P/B Ratio (0.155) is normal, around the industry mean (14.238). P/E Ratio (2.203) is within average values for comparable stocks, (65.927). Projected Growth (PEG Ratio) (0.000) is also within normal values, averaging (1.646). MLGO has a moderately low Dividend Yield (0.000) as compared to the industry average of (0.023). P/S Ratio (0.596) is also within normal values, averaging (138.881).
The Tickeron PE Growth Rating for this company is (best 1 - 100 worst), pointing to outstanding earnings growth. The PE Growth rating is based on a comparative analysis of stock PE ratio increase over the last 12 months compared against S&P 500 index constituents.
The Tickeron Price Growth Rating for this company is (best 1 - 100 worst), indicating fairly steady price growth. MLGO’s price grows at a lower rate over the last 12 months as compared to S&P 500 index constituents.
The Tickeron SMR rating for this company is (best 1 - 100 worst), indicating weak sales and an unprofitable business model. SMR (Sales, Margin, Return on Equity) rating is based on comparative analysis of weighted Sales, Income Margin and Return on Equity values compared against S&P 500 index constituents. The weighted SMR value is a proprietary formula developed by Tickeron and represents an overall profitability measure for a stock.
The Tickeron Profit vs. Risk Rating rating for this company is (best 1 - 100 worst), indicating that the returns do not compensate for the risks. MLGO’s unstable profits reported over time resulted in significant Drawdowns within these last five years. A stable profit reduces stock drawdown and volatility. The average Profit vs. Risk Rating rating for the industry is 93, placing this stock worse than average.
Notable companies
Industry description
Market Cap
High and low price notable news
Volume
Fundamental Analysis Ratings
The average fundamental analysis ratings, where 1 is best and 100 is worst, are as follows

Advertisement
General Information
Industry ComputerCommunications
Advertisement