


AI Robots: Top 10 Trend Traders,Virtual Accounts
Market volatility reflects the degree of fluctuation in prices of securities, such as stocks, within a particular period. It is driven by various factors like economic data, investor sentiment, and geopolitical events. For instance, the Volatility Index (VIX), which measures market risk, dropped by 2.47%, signaling less fear among traders for the period. Major indexes like SPY (S&P 500 ETF), which gained 1.42%, are typically used as indicators of overall market health, while others like QQQ (tracking the tech-heavy NASDAQ) saw a rise of 1.49%. Despite gains in stock indexes, volatility indexes like VXN fell 4.37%, suggesting reduced uncertainty in tech stocks.
Analyzing the different performances of major indexes provides insight into the market's dynamics. The small-cap index IWM increased by 2.18%, while its volatility measure (RVX) dropped by 14.47%, reflecting stronger confidence in smaller companies. The DIA, representing the Dow Jones Industrial Average, also saw gains of 1.65%, though its volatility index (VXD) rose by 2%, pointing to mixed sentiments about industrial stocks. Together, these indexes help investors navigate and assess risk within a shifting economic landscape.
Trend Trader for Mid Caps ($2.5K per position): Comprehensive Intrinsic Sentinel (FA)

The "Trend Trader for Mid Caps" robot is designed for value investing, focusing on mid-cap companies whose intrinsic value surpasses their current market price. It uses several ranking systems—Piotroski, Debt, Gain, NCAV, and Greenblatt—to assess a company's financial health, growth, and market efficiency. This robot seeks to identify undervalued stocks and takes long positions in those with the highest rankings. It's suitable for hedge funds or expert investors looking for high profit-to-drawdown ratios, navigating through medium-volatility markets, while managing risk with a fixed stop-loss strategy.
Click to view the full description and closed trades for free!
Trend Trader for RUSSELL 2000 ($2.5K per position): Magic Formula & Optimal Structure (FA)
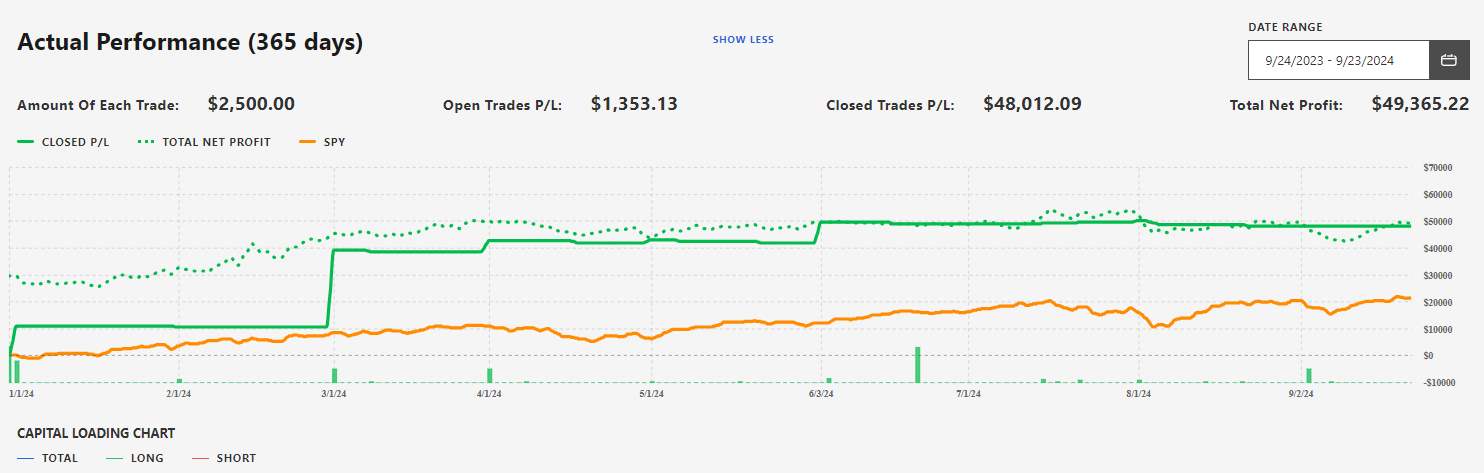
The Trend Trader for RUSSELL 2000 is a trading algorithm rooted in value investing principles, specifically designed to help experts, hedge funds, and beginners alike. Its dual-layer filtering system, which combines the Debt Ranking and the Greenblatt Ranking, identifies high-quality, undervalued stocks with strong financial fundamentals. By targeting companies from the Russell 2000 index, the robot narrows its focus on firms with significant growth potential. Its structured approach to position management, including a fixed stop-loss of 25% and the ability to hold up to 35 open trades, allows traders to balance risk while pursuing profitability in the stock market.
Click to view the full description and closed trades for free!
Trend Trader for Broad Market ($2.5K per position): Debt Efficiency and Earnings Yield (FA)
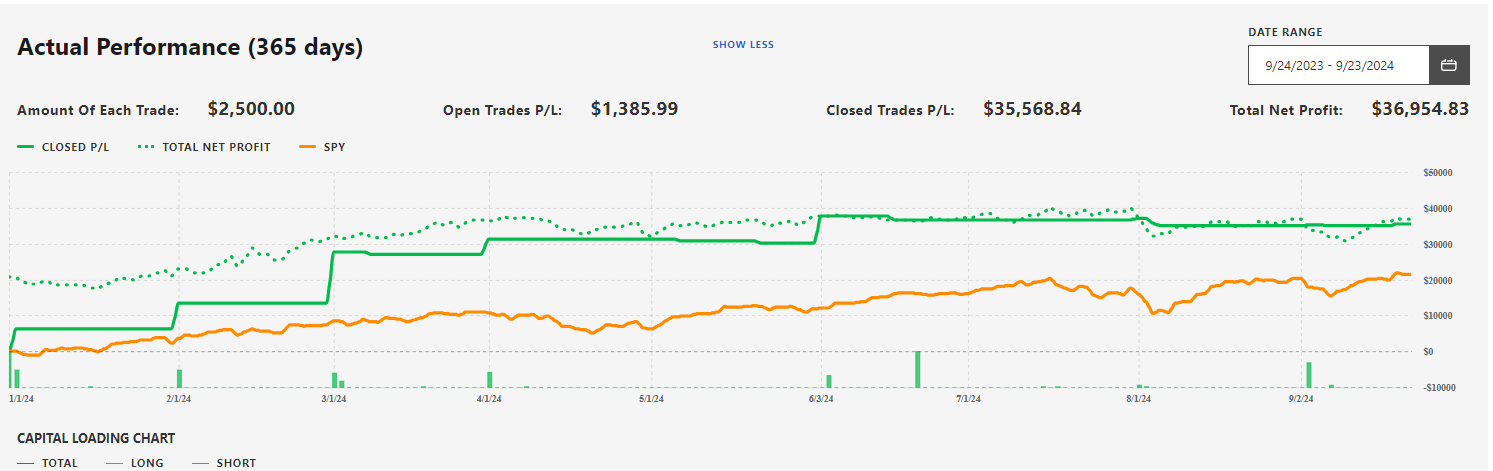
This trading robot is crafted for expert investors and hedge funds that focus on value investing. It excels at identifying undervalued companies through fundamental analysis, targeting those with intrinsic value greater than their market price. Utilizing the Debt and Greenblatt Ranking systems, the robot screens for financially sound firms and those with strong returns on capital. It operates monthly, balancing long-term strategies with trend responsiveness, and ensures risk management with a 35-trade limit and 25% stop loss. This makes it versatile across market segments like Russell and various capitalization levels, while its volatility profile suits investors aiming for high returns.
Click to view the full description and closed trades for free!
Trend Trader for Large Caps ($2.5K per position): Focusing on Intrinsic Value Metrics (FA)
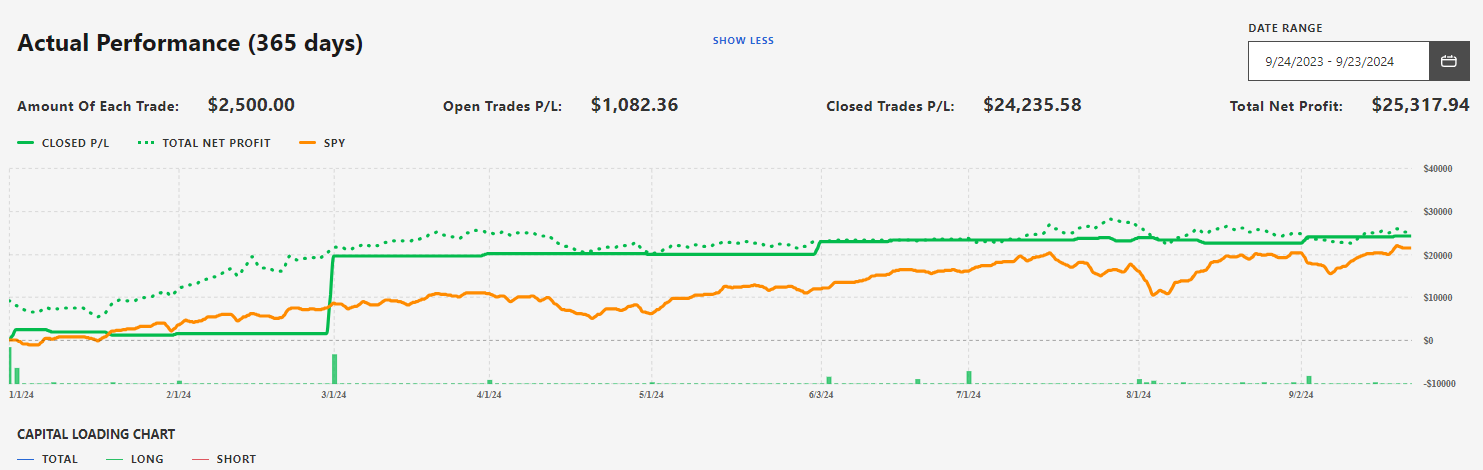
This robot is a powerful tool tailored for novice and experienced investors alike, focusing on applying value investing principles within the large-cap stock universe. Designed to identify stocks trading below their intrinsic value, it leverages sophisticated ranking systems like Piotroski, Debt, Gain, NCAV, and Greenblatt to assess a company's financial health, growth potential, and market efficiency. With a clear strategy based on deep value investing, the robot targets stocks that are temporarily undervalued due to market inefficiencies, offering potential for high short-term gains. Its structured approach includes managing up to 35 open trades, setting a fixed stop loss, and utilizing market orders to optimize liquidity. High volatility adaptability, moderate universe diversification, and a focus on favorable profit-to-drawdown ratios make this robot suitable for a wide range of investors seeking both high returns and effective risk management.
Click to view the full description and closed trades for free!
Trend Trader for Small Caps ($2.5K per position): Evaluating True Intrinsic Value (FA)

The Experts or Hedge Funds bot for Small Caps is designed to identify undervalued companies by assessing their core financial health, making it ideal for value investors and options traders focused on small-cap stocks. Using advanced financial rankings such as Piotroski, Debt, Gain, NCAV, and Greenblatt, the bot targets stocks with strong growth potential, sound creditworthiness, and market mispricings. Its risk management strategy limits open trades to 35, with a fixed stop loss, ensuring a balanced approach to volatility. The bot excels in medium volatility markets, with a high profit-to-drawdown ratio, making it a suitable choice for traders seeking high returns with controlled risks.
Click to view the full description and closed trades for free!
Trend Trader for RUSELL 2000 ($2.5K per position): Dynamic Growth & Stability Chaser (FA)

The robot is designed for hedge funds and expert investors focused on value-driven strategies, particularly within the RUSSELL 2000 index. By leveraging a dual-algorithm approach—Debt Ranking and Gain Ranking—the robot identifies undervalued firms with strong financial health and robust growth potential. It first assesses companies for stability using Debt Ranking, then selects those with significant profitability through Gain Ranking. This systematic process helps investors capture opportunities in firms whose market prices lag behind their intrinsic value. Risk management is emphasized, with the robot maintaining a maximum of 35 trades and applying a 25% stop-loss to mitigate downside risks, ensuring both growth and stability in various market conditions.
Click to view the full description and closed trades for free!
Trend Trader for Broad Market ($2.5K per position): Optimal Financial Fusion (FA)

The Creditworthiness & Healthy Growth Synthesis robot is a sophisticated tool tailored for hedge funds and expert investors, combining systematic strategies with value-based investing principles. It excels at identifying undervalued companies through fundamental analysis, helping traders align their investments with intrinsic value. The robot's two core evaluative frameworks, Debt Ranking and Gain Ranking, prioritize financial health and sustainable growth, ensuring a refined stock selection process. With a maximum of 60 open trades and strict risk management policies like a 25% stop-loss limit, the robot balances risk and growth effectively. It is optimized for high-volatility markets, offering broad portfolio diversification and targeting stocks with strong profit-to-drawdown ratios, making it a valuable asset for sophisticated market players.
Click to view the full description and closed trades for free!
Trend Trader for Small Caps ($2.5K per position): Magic Formula & Optimal Structure (FA)
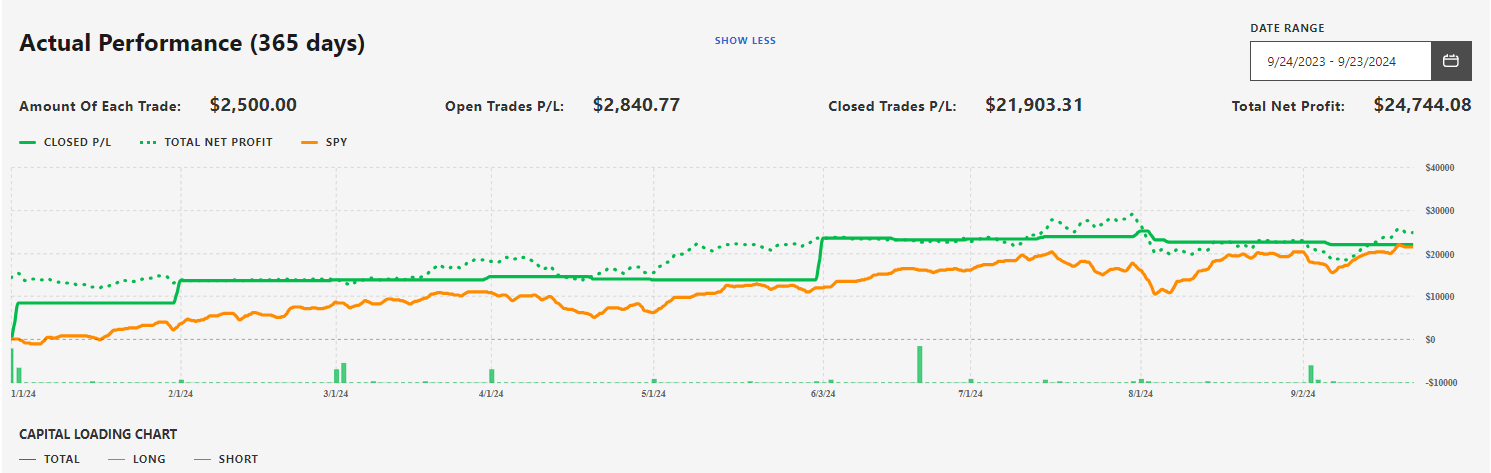
This advanced trading bot is designed for experts and hedge funds, leveraging value investing principles to focus on small-cap stocks trading below intrinsic value. Its dual-layered approach combines proprietary Debt Ranking and Greenblatt Ranking tools to assess financial stability and operational efficiency, filtering out underperforming companies. The robot can hold up to 35 open trades, incorporating risk management features like a 25% stop-loss to limit exposure and safeguard capital. It executes trades early in the market session to capitalize on liquidity, aiming for high-profit opportunities while navigating market volatility. This systemized, disciplined method offers high confidence in stock selection, making it ideal for experienced investors seeking robust returns with minimized risk in small-cap investments.
Click to view the full description and closed trades for free!
Trend Trader for Small Caps ($2.5K per position): Dynamic Growth & Stability Chaser (FA)
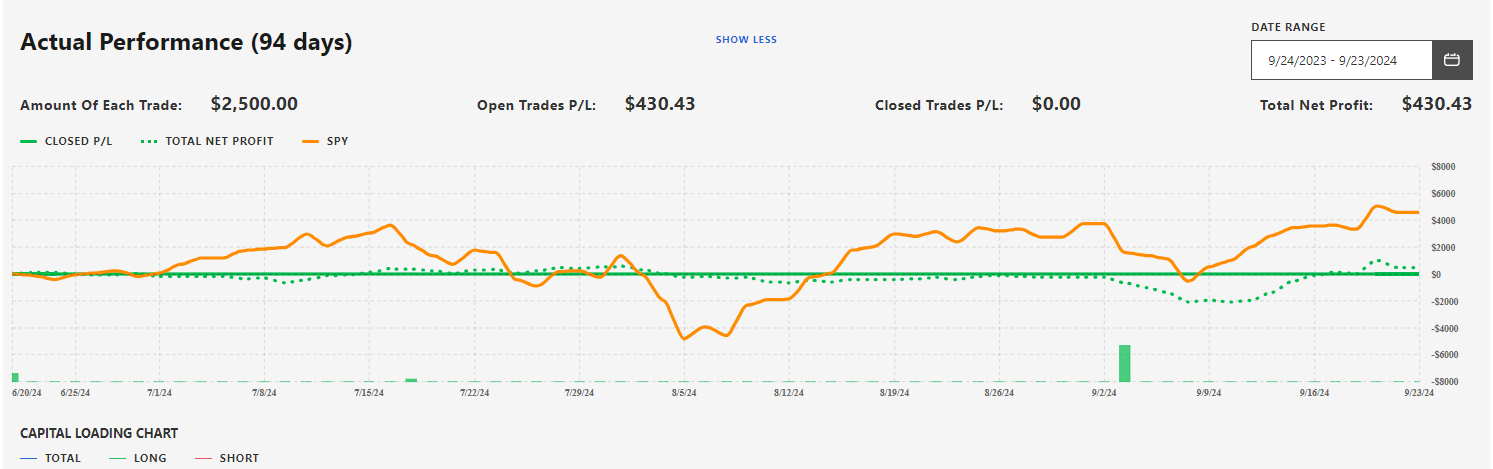
This trading robot is tailored for expert investors and hedge funds, with a focus on small-cap stocks and a value-investing strategy. By employing advanced analytical tools like Debt Ranking, which identifies financially stable companies with low debt, and Gain Ranking, which filters for those with high growth potential, the robot ensures that only fundamentally sound and growth-oriented stocks are selected for trading. It manages up to 35 open trades at once, spreading risk and applying a 25% stop loss on each position to control potential losses. Trades are executed during high liquidity periods, optimizing entry prices. With medium-high diversification and a focus on both profit and risk management, this robot is well-suited for navigating medium volatility markets, providing valuable tools for both beginners and seasoned traders.
Click to view the full description and closed trades for free!
Trend Trader ($1.5K per position): Integrating Credit Stability and Growth Objectives (FA)
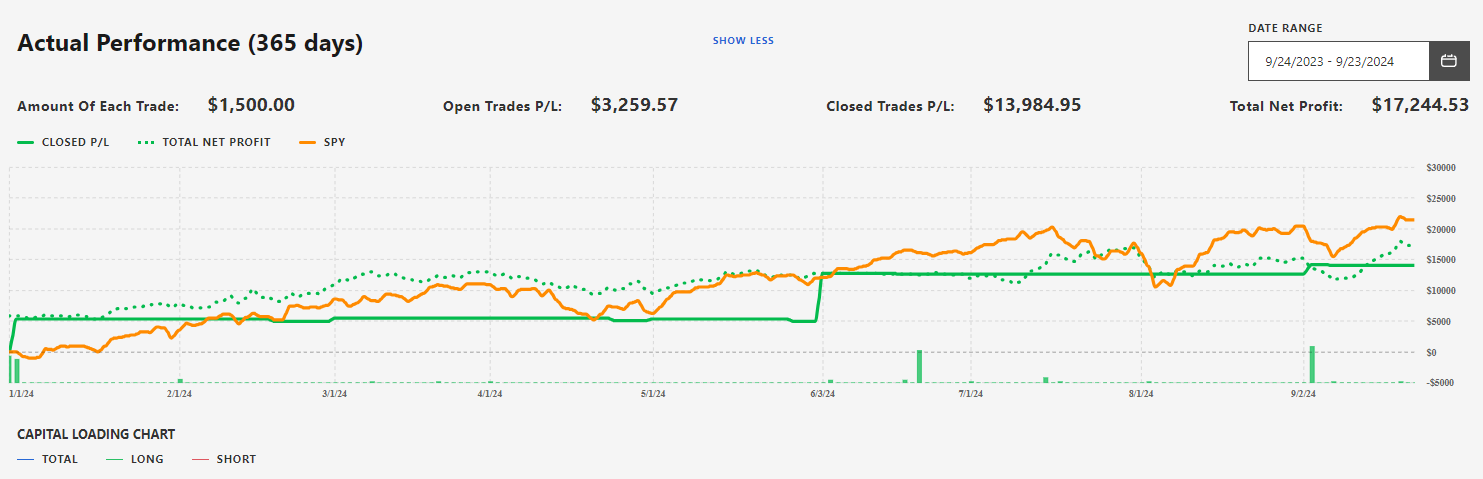
The robot is a sophisticated trading tool tailored for Experts and Hedge Funds, merging value investing principles with a systematic, data-driven strategy. Its dual evaluative frameworks, Debt Ranking and Gain Ranking, ensure a precise selection of financially sound and growth-oriented companies. The robot screens stocks based on fundamental analysis, refining its choices through a rigorous process that emphasizes creditworthiness and sustainable growth. Its disciplined position and risk management system, including a 60-trade limit and a 25% stop loss policy, offers a balanced approach to diversification and capital preservation. With high volatility tolerance and universe diversification, this robot is optimized for navigating various market conditions while focusing on high returns and low drawdown, making it a valuable asset for strategic trading.
Click to view the full description and closed trades for free!
Conclusion
The AI-driven trading robots presented offer sophisticated, value-based strategies tailored to various market segments, from small to large-cap stocks. These algorithms leverage advanced financial analysis tools, such as Debt Ranking and Greenblatt Ranking, to identify undervalued companies with strong growth potential. With features like fixed stop-loss limits and a cap on open trades, these robots prioritize risk management while aiming for high profit-to-drawdown ratios. Whether navigating high or medium-volatility markets, these systems provide investors—both novices and experts—with a disciplined, systematic approach to trading, enabling them to capitalize on market opportunities with minimized risk.
Contributor
Sergey Savastiouk, Ph.D. has a degree in Applied Mathematics from Moscow University and has extensive experience as an entrepreneur, investor, manager, and mathematician. His professional expertise is in applied mathematics, mathematical modeling, system and pattern analysis, and software and hardware system integration. He has served as the CEO of several hi-tech start-up companies and nonprofit organizations, which has given him proven capabilities in business strategy for high-tech start-up companies, market assessment, company formation, team building, product development, marketing, and sales. He has published numerous articles in journals and magazines on related fields. As a retail investor, he spent 15 years developing his proprietary trading and quantitative algorithms (now Tickeron’s A.I.), which brought him significant returns in trading the stock market. His current work and goal in founding Tickeron is to bring professional, sophisticated stock market analysis capabilities to retail investors via an easy-to-use interface.
Momentum Indicator for SPY turns positive, indicating new upward trend
SPY saw its Momentum Indicator move above the 0 level on September 21, 2026. This is an indication that the stock could be shifting in to a new upward move. Traders may want to consider buying the stock or buying call options. Tickeron's A.I.dvisor looked at 76 similar instances where the indicator turned positive. In 67 of the 76 cases, the stock moved higher in the following days. The odds of a move higher are at 88%.

Technical Analysis (Indicators)
Bullish Trend Analysis
The Moving Average Convergence Divergence (MACD) for SPY just turned positive on October 02, 2026. Looking at past instances where SPY's MACD turned positive, the stock continued to rise in 42 of 52 cases over the following month. The odds of a continued upward trend are 81%.
SPY moved above its 50-day moving average on September 17, 2026 date and that indicates a change from a downward trend to an upward trend.
Following a +1.42% 3-day Advance, the price is estimated to grow further. Considering data from situations where SPY advanced for three days, in 301 of 362 cases, the price rose further within the following month. The odds of a continued upward trend are 83%.
Bearish Trend Analysis
The Stochastic Oscillator may be shifting from an upward trend to a downward trend. In 51 of 70 cases where SPY's Stochastic Oscillator exited the overbought zone, the price fell further within the following month. The odds of a continued downward trend are 73%.
Following a 3-day decline, the stock is projected to fall further. Considering past instances where SPY declined for three days, the price rose further in 50 of 62 cases within the following month. The odds of a continued downward trend are 75%.
SPY broke above its upper Bollinger Band on September 21, 2026. This could be a sign that the stock is set to drop as the stock moves back below the upper band and toward the middle band. You may want to consider selling the stock or exploring put options.
The Aroon Indicator for SPY entered a downward trend on September 21, 2026. This could indicate a strong downward move is ahead for the stock. Traders may want to consider selling the stock or buying put options.
Notable companies
Industry description
Market Cap
High and low price notable news
Volume
Fundamental Analysis Ratings
The average fundamental analysis ratings, where 1 is best and 100 is worst, are as follows

Advertisement
General Information
Category LargeBlend
Advertisement