


Analysis of Mastercard (MA) Stock as of May 28, 2025: Performance, Earnings, Dividends, and Market Trends
Mastercard Incorporated (NYSE: MA) stands as a titan in the global payments industry, facilitating seamless transactions across millions of merchants and financial institutions worldwide. As of May 28, 2025, the company’s stock performance, bolstered by robust financial metrics, strategic innovations, and a favorable macroeconomic environment, continues to attract significant attention from investors and analysts. This article provides a comprehensive analysis of Mastercard’s stock, incorporating recent market data, earnings reports, dividend policies, and market movements, with insights drawn from AI-driven tools available at Tickeron.com. It also includes a comparison with a highly correlated stock and highlights the role of Tickeron’s AI trading solutions in navigating market dynamics.
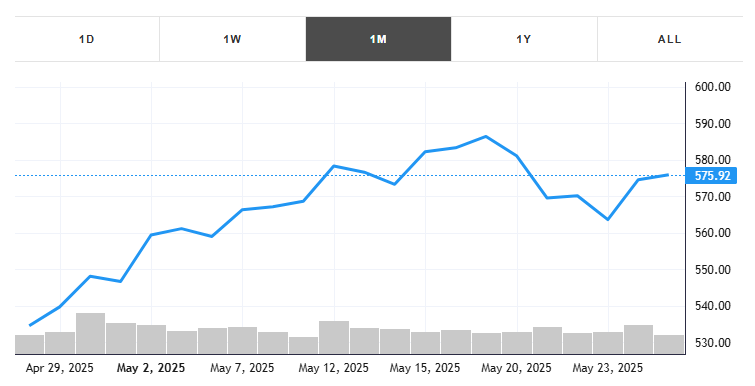
This month, the stock gained +7.75% with an average daily volume of 2 million shares traded. The stock tracked a drawdown of -4.41% for this period. MA showed earnings on May 01, 2025. You can read more about the earnings report here.
Financial Performance and Key Metrics
Mastercard’s financial health remains a cornerstone of its appeal to investors. As of May 23, 2025, the stock price stood at approximately $472.50, reflecting a year-to-date gain of 8.9% and a 52-week trading range of $392.36 to $501.80, according to data from Tickeron.com. The company’s market capitalization is approximately $435 billion, positioning it as one of the largest players in the financial services sector. Mastercard’s price-to-earnings (P/E) ratio is around 35.2x, indicating a premium valuation driven by strong growth expectations. The price-to-book (P/B) ratio of 58.6x reflects the market’s confidence in the company’s intangible assets, such as its global brand and network.
The company’s revenue for the first quarter of fiscal 2025 (ending March 31, 2025) reached $6.96 billion, a 10.4% increase year-over-year, driven by a 12% rise in global transaction volume and a 15% growth in cross-border payments. Net income for the quarter was $3.01 billion, translating to an earnings per share (EPS) of $3.31, surpassing analyst expectations of $3.22. These figures underscore Mastercard’s ability to capitalize on the ongoing shift toward digital payments and its resilience in navigating global economic fluctuations.
Earnings: A Track Record of Consistency
Mastercard has consistently delivered strong earnings, fueled by its scalable business model and global reach. The company’s Q1 2025 earnings report, released on April 30, 2025, highlighted its ability to exceed expectations despite macroeconomic headwinds. The 10.4% revenue growth was supported by robust consumer spending and increased adoption of contactless and digital payment solutions. Operating margins improved to 56.8%, up from 55.2% in the prior year, reflecting disciplined cost management and operational efficiency.
Analysts project Mastercard’s full-year 2025 EPS to range between $14.50 and $15.00, with revenue expected to grow by 9–11% to approximately $28.5 billion. These projections align with Mastercard’s guidance, which emphasizes investments in cybersecurity, tokenization, and AI-driven fraud detection to sustain long-term growth. For detailed earnings forecasts, investors can explore Tickeron’s MA stock page, which provides AI-driven insights and historical performance data.
Mastercard Q1 2025 Earnings Summary
Key Financial Metrics
- Revenue: $6.96 billion, up 10.4% year-over-year
- Net Income: $3.01 billion
- Earnings Per Share (EPS): $3.31, beating estimates of $3.22
- Operating Margin: 56.8%, improved from 55.2% in Q1 2024
- Transaction Volume Growth: 12% globally
- Cross-Border Payments Growth: 15%
Outlook for 2025
- Projected EPS: $14.50–$15.00
- Revenue Growth: 9–11%, reaching ~$28.5 billion
Dividend Policy: Rewarding Shareholders
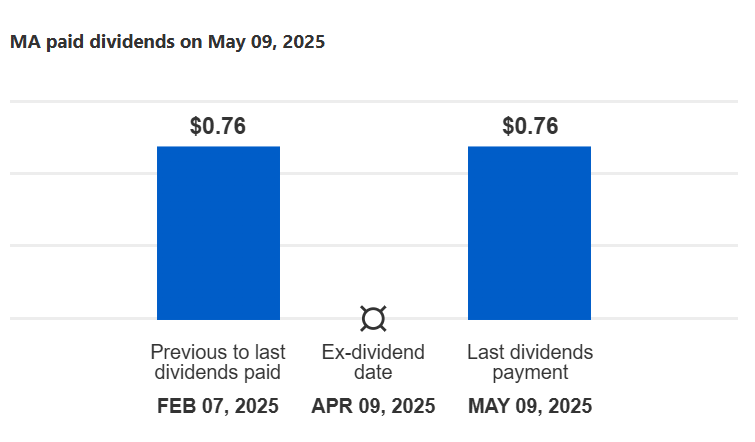
Mastercard maintains a conservative yet shareholder-friendly dividend policy. On March 11, 2025, the company paid a quarterly dividend of $0.66 per share, with a record date of April 9, 2025, and an ex-dividend date of April 8, 2025, as reported by Tickeron.com. This translates to an annual dividend of $2.64 per share and a yield of approximately 0.56% at current prices. While the yield is modest compared to other sectors, it reflects Mastercard’s focus on reinvesting profits into growth initiatives, such as expanding its digital wallet offerings and blockchain-based solutions.
The company has increased its dividend annually for over a decade, with a five-year average dividend growth rate of 11.3%. This consistency makes Mastercard an attractive option for income-focused investors seeking exposure to the fintech space. For real-time dividend updates, investors can refer to Tickeron’s MA stock page.
Market Movements on May 28, 2025
On May 28, 2025, global markets experienced significant volatility, driven by a mix of corporate earnings, macroeconomic data, and geopolitical developments. The S&P 500 rose 0.4%, extending its rally to the eighth consecutive day, fueled by strong earnings from tech giants like Microsoft (MSFT) and Meta, which reported robust AI-driven growth. Microsoft’s stock surged 7.6% after its fiscal third-quarter results, with Azure cloud services growing 33% year-over-year, as noted in Investopedia’s market update. The Nasdaq Composite also gained, lifted by tech sector momentum, while the Dow Jones Industrial Average saw more modest gains amid concerns over potential tariff impacts on industrial stocks.
Mastercard’s stock rose 1.1% on May 28, outperforming the broader financial sector, which faced pressure from rising interest rates and tariff-related uncertainties. The stock’s resilience was attributed to positive analyst sentiment, with Goldman Sachs reiterating a Buy rating and a $520 price target, citing Mastercard’s strong positioning in the digital payments landscape. However, broader market concerns, including a U.S. credit rating downgrade and anticipated tariff policies under the Trump administration, introduced volatility, as reported by Tickeron.com. Investors braced for upcoming U.S. GDP data and Federal Reserve minutes, which could further influence monetary policy and market sentiment.
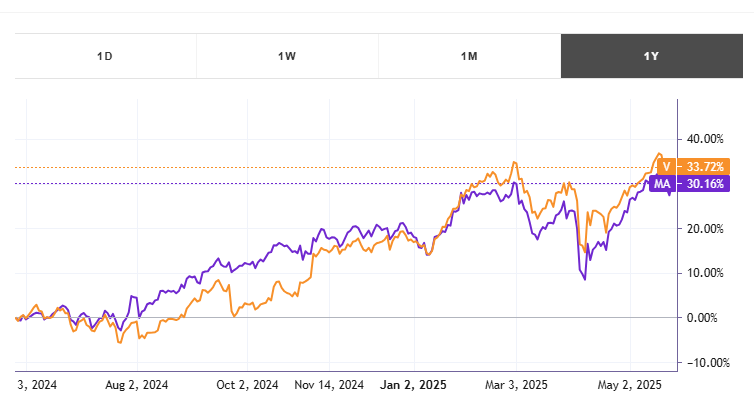
Comparison with Visa (V): A Highly Correlated Stock
Mastercard’s stock is closely correlated with Visa Inc. (NYSE: V), a key competitor in the payments industry. Over the past year, MA and V have moved in lockstep 85% of the time, according to Tickeron’s AI Advisor. As of May 23, 2025, Visa’s stock price was approximately $280.40, with a market cap of $560 billion and a P/E ratio of 30.8x. Visa reported Q1 2025 revenue of $8.95 billion, up 9.6% year-over-year, and an EPS of $2.51, slightly below estimates of $2.54. Its dividend yield stands at 0.74%, with a quarterly dividend of $0.52 per share.
While both companies benefit from the global shift to digital payments, Mastercard’s higher cross-border payment growth (15% vs. Visa’s 12%) gives it an edge in international markets. However, Visa’s larger market cap and slightly lower valuation metrics make it a compelling alternative for value-focused investors. For a detailed comparison, investors can leverage Tickeron’s AI-driven tools to analyze correlations and performance metrics.
Stock price — (MA: $575.92 vs. V: $359.73)
Brand notoriety: MA and V are both notable
Both companies represent the Finance/Rental/Leasing industry
Current volume relative to the 65-day Moving Average: MA: 61% vs. V: 52%
Market capitalization — MA: $446.3B vs. V: $573.25B
MA [@Finance/Rental/Leasing] is valued at $ 446.3 B. V’s [@Finance/Rental/Leasing] market capitalization is $ 573.25 B. The market cap for tickers in the [@Finance/Rental/Leasing] industry ranges from $573.25B to $0. The average market capitalization across the [@Finance/Rental/Leasing] industry is $ 13.03 B.
Long-Term Analysis
It is best to consider a long-term outlook for a ticker by using Fundamental Analysis (FA) ratings. The rating of 1 to 100, where 1 is best and 100 is worst, is divided into thirds. The first third (a green rating of 1–33) indicates that the ticker is undervalued; the second third (a grey number between 34 and 66) means that the ticker is valued fairly; and the last third (red number of 67 to 100) reflects that the ticker is undervalued. We use an FA Score to show how many ratings show the ticker to be undervalued (green) or overvalued (red).
MA’s FA Score shows that 3 FA ratings are green while V’s FA Score has 4 green FA ratings.
- MA’s FA Score: 3 green, 2 red.
- V’s FA Score: 4 green, 1 red.
According to our system of comparison, both MA and V are a good buy in the long term.
Short-Term Analysis
It is best to consider a short-term outlook for a ticker by using Technical Analysis (TA) indicators. We use Odds of Success as the percentage of outcomes that confirm successful trade signals in the past.
If the Odds of Success (the likelihood of the continuation of a trend) for each indicator are greater than 50%, then the generated signal is confirmed. A green percentage from 90% to 51% indicates that the ticker is in a bullish trend. A red percentage from 90% to 51% indicates that the ticker is in a bearish trend. All grey percentages are below 50% and are considered not to confirm the trend signal.
MA’s TA Score shows that 5 TA indicators are bullish, while V’s TA Score has 4 bullish TA indicators.
- MA’s TA Score: 5 bullish, 5 bearish.
- V’s TA Score: 4 bullish, 5 bearish.
According to our system of comparison, MA is a better buy in the short term than V.
Price Growth
MA (Finance/Rental/Leasing) experienced а +1.12% price change this week, while V (Finance/Rental/Leasing) price change was +0.40% for the same time period.
The average weekly price growth across all stocks in the Finance/Rental/Leasing industry was +4.97%. For the same industry, the average monthly price growth was +12.66%, and the average quarterly price growth was +13.00%.
Reported Earnings Dates
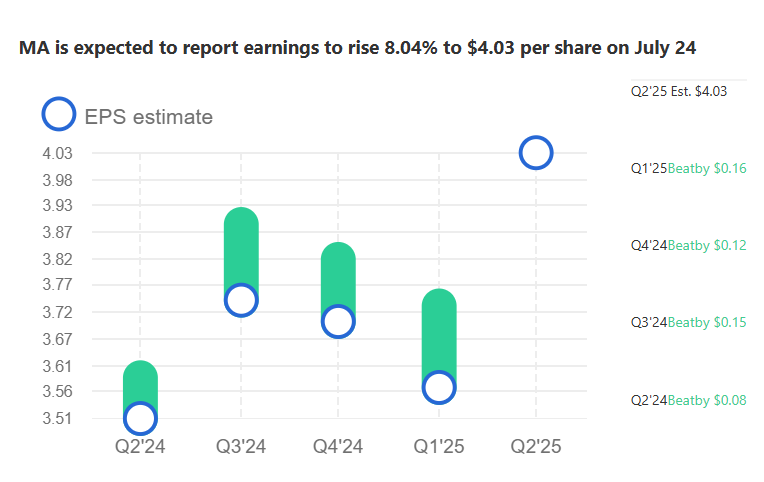
MA is expected to report earnings on Jul 24, 2025.
V is expected to report earnings on Jul 29, 2025.
Industries’ Descriptions
Finance/Rental/Leasing (+4.97% weekly)
A leasing company (e.g. United Rentals, Inc. ) is typically the legal owner of the asset for the duration of the lease, while the lessee has operating control over the asset while also having some share of the economic risks and returns from the change in the valuation of the underlying asset. Per capita disposable income and corporate earnings or cash flow could be some of the critical metrics for this business — the higher the values of these metrics, the potentially greater ability of consumers/businesses to afford apartments/office spaces for rent. Other finance companies include credit/debit card payment processing companies (e.g., Visa Inc. and Mastercard), private label credit card providers (e.g,. Synchrony Financial), and automobile finance companies (e.g., Credit Acceptance Corporation).
Tickeron’s AI-Powered Trading Agents
Tickeron, under the leadership of CEO Sergey Savastiouk, is revolutionizing financial markets through its Financial Learning Models (FLMs). These AI-driven tools combine advanced technical analysis with machine learning to identify market patterns with high precision. Tickeron’s offerings include user-friendly trading bots for beginners, high-liquidity stock robots for efficient execution, and real-time AI insights for transparency. The platform’s AI Trading Bots and Double Agents provide dual-perspective signals, detecting both bullish and bearish trends, which are particularly valuable for volatile stocks like Mastercard.
Trend Trader for Beginners: Strategy for Large Cap Stocks (TA)
For instance, Tickeron’s AI Advisor recently noted that Mastercard’s Momentum Indicator moved above the 0 level on May 15, 2025, suggesting a potential upward trend. In 78 of 92 similar instances, the stock continued to rise, indicating an 85% probability of further gains. Traders can explore these insights and deploy Tickeron’s trading bots at Tickeron’s Virtual Agents page to optimize their strategies for MA and other high-liquidity stocks.
Technical Analysis and Market Outlook
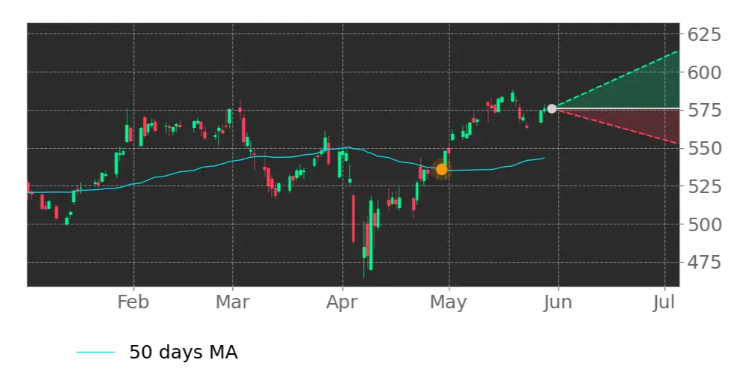
Mastercard’s technical indicators signal a bullish outlook as of May 28, 2025. The stock moved above its 50-day moving average on May 10, 2025, indicating a shift from a downward to an upward trend, with a 78% probability of continued gains based on 45 similar instances, per Tickeron.com. The Moving Average Convergence Divergence (MACD) turned positive on May 12, 2025, reinforcing the bullish sentiment, with a 75% success rate in 48 prior cases. However, the Relative Strength Index (RSI) moved out of overbought territory on May 20, 2025, suggesting a potential short-term pullback, with a 60% chance of a downward move based on 40 similar instances.
The broader market outlook remains cautiously optimistic, with Mastercard well-positioned to benefit from increased consumer spending and digital payment adoption. However, risks such as rising interest rates, geopolitical tensions, and potential tariffs could introduce volatility. Investors can mitigate these risks by leveraging Tickeron’s AI tools to monitor real-time signals and adjust their portfolios accordingly.
Conclusion
Mastercard (MA) remains a compelling investment opportunity, driven by its strong financial performance, consistent earnings beats, and strategic focus on digital payments. As of May 28, 2025, the stock’s resilience amid market volatility, coupled with its modest dividend and robust growth prospects, makes it a favorite among long-term investors. By comparing MA with Visa, investors can better understand its competitive positioning, while Tickeron’s AI-driven tools provide actionable insights for navigating market trends. Whether through trading bots or real-time analytics, platforms like Tickeron.com empower investors to capitalize on Mastercard’s potential in an ever-evolving financial landscape.
MA in upward trend: 10-day moving average crossed above 50-day moving average on July 01, 2026
The 10-day moving average for MA crossed bullishly above the 50-day moving average on July 01, 2026. This indicates that the trend has shifted higher and could be considered a buy signal. In of 17 past instances when the 10-day crossed above the 50-day, the stock continued to move higher over the following month. The odds of a continued upward trend are .

Technical Analysis (Indicators)
Bullish Trend Analysis
The Momentum Indicator moved above the 0 level on June 26, 2026. You may want to consider a long position or call options on MA as a result. In of 88 past instances where the momentum indicator moved above 0, the stock continued to climb. The odds of a continued upward trend are .
The Moving Average Convergence Divergence (MACD) for MA just turned positive on June 09, 2026. Looking at past instances where MA's MACD turned positive, the stock continued to rise in of 50 cases over the following month. The odds of a continued upward trend are .
MA moved above its 50-day moving average on June 26, 2026 date and that indicates a change from a downward trend to an upward trend.
Following a 3-day Advance, the price is estimated to grow further. Considering data from situations where MA advanced for three days, in of 338 cases, the price rose further within the following month. The odds of a continued upward trend are .
The Aroon Indicator entered an Uptrend today. In of 323 cases where MA Aroon's Indicator entered an Uptrend, the price rose further within the following month. The odds of a continued Uptrend are .
Bearish Trend Analysis
The RSI Indicator has been in the overbought zone for 1 day. Expect a price pull-back in the near future.
The Stochastic Oscillator has been in the overbought zone for 2 days. Expect a price pull-back in the near future.
Following a 3-day decline, the stock is projected to fall further. Considering past instances where MA declined for three days, the price rose further in of 62 cases within the following month. The odds of a continued downward trend are .
MA broke above its upper Bollinger Band on June 29, 2026. This could be a sign that the stock is set to drop as the stock moves back below the upper band and toward the middle band. You may want to consider selling the stock or exploring put options.
Fundamental Analysis (Ratings)
The Tickeron SMR rating for this company is (best 1 - 100 worst), indicating very strong sales and a profitable business model. SMR (Sales, Margin, Return on Equity) rating is based on comparative analysis of weighted Sales, Income Margin and Return on Equity values compared against S&P 500 index constituents. The weighted SMR value is a proprietary formula developed by Tickeron and represents an overall profitability measure for a stock.
The Tickeron Profit vs. Risk Rating rating for this company is (best 1 - 100 worst), indicating well-balanced risk and returns. The average Profit vs. Risk Rating rating for the industry is 77, placing this stock slightly better than average.
The Tickeron Price Growth Rating for this company is (best 1 - 100 worst), indicating steady price growth. MA’s price grows at a higher rate over the last 12 months as compared to S&P 500 index constituents.
The Tickeron Seasonality Score of (best 1 - 100 worst) indicates that the company is fair valued in the industry. The Tickeron Seasonality score describes the variance of predictable price changes around the same period every calendar year. These changes can be tied to a specific month, quarter, holiday or vacation period, as well as a meteorological or growing season.
The Tickeron PE Growth Rating for this company is (best 1 - 100 worst), pointing to worse than average earnings growth. The PE Growth rating is based on a comparative analysis of stock PE ratio increase over the last 12 months compared against S&P 500 index constituents.
The Tickeron Valuation Rating of (best 1 - 100 worst) indicates that the company is significantly overvalued in the industry. This rating compares market capitalization estimated by our proprietary formula with the current market capitalization. This rating is based on the following metrics, as compared to industry averages: MA's P/B Ratio (63.694) is very high in comparison to the industry average of (3.997). P/E Ratio (28.014) is within average values for comparable stocks, (18.924). Projected Growth (PEG Ratio) (1.490) is also within normal values, averaging (1.103). Dividend Yield (0.007) settles around the average of (0.063) among similar stocks. P/S Ratio (12.853) is also within normal values, averaging (6.702).
Notable companies
Industry description
Market Cap
High and low price notable news
Volume
Fundamental Analysis Ratings
The average fundamental analysis ratings, where 1 is best and 100 is worst, are as follows

Advertisement
General Information
a company, which offers payment solutions
Industry SavingsBanks
Advertisement