


Review of the Top Performer: June 23, 2025 — Tickeron's New FLMs Produce Groundbreaking AI Trading Outcomes
Introduction: AI Trading Redefined with Enhanced FLMs
On June 23, 2025, Tickeron reported a significant performance milestone following the release of its new generation Financial Learning Models (FLMs). These advanced AI engines have notably accelerated both learning and market reaction speeds, enabling the launch of highly responsive Virtual Agents operating on shorter timeframes—specifically, the 15-minute and 5-minute charts. This innovation has transformed how traders interact with the market, improving decision-making speed and trading precision across a variety of equities and ETFs.
The Power of 15-Minute Virtual Agents
Tickeron’s new Virtual Agents working on a 15-minute timeframe represent a strategic leap forward in real-time trading intelligence. These agents leverage FLMs to analyze high-frequency market data, identify actionable signals, and execute trades faster and more accurately than ever. By reducing lag and increasing adaptability, these agents help users capitalize on intraday market opportunities with an edge previously unattainable for most individual investors.
Key highlights include dual-agent strategies that analyze paired instruments—such as AMD/SOXS and AMD/AMDS—allowing for simultaneous analysis of correlated or inversely correlated assets.
Top 5 Performing AI Trading Agents – June 2025
Below are the standout trading agents that delivered exceptional annualized returns using Tickeron’s new 15-minute FLMs. These figures are based on model-driven intraday trades, demonstrating both the agility and depth of the upgraded system.
1. AMD / SOXS - Double Agent (15min)
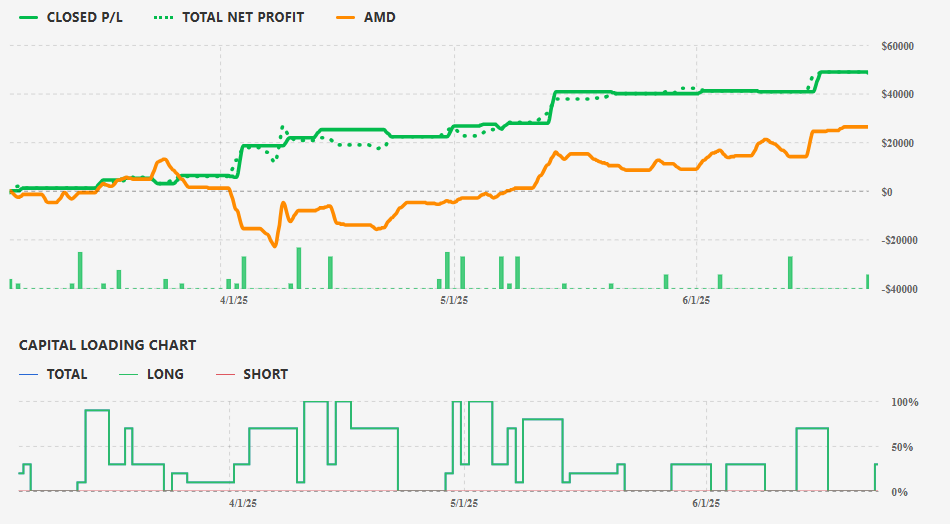
- Annualized Return: +270%
This dual-agent strategy pairs semiconductor leader AMD with the inverse ETF SOXS, generating high returns by detecting opposing price movements. The FLMs recognize trend reversals and market sentiment shifts to exploit both bullish AMD activity and bearish semiconductor index moves via SOXS.
2. AMD / AMDS - Double Agent (15min)
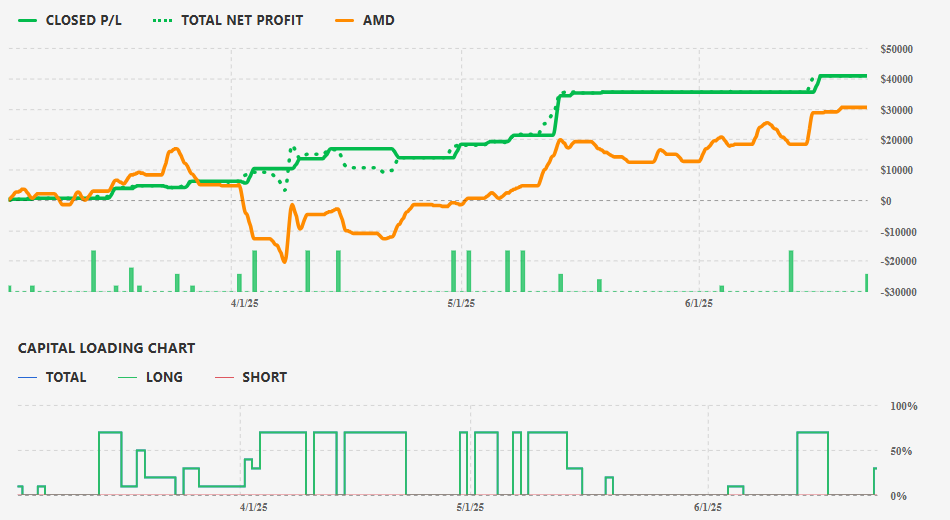
- Annualized Return: +202%
The pairing of AMD with its derivative AMDS allows the AI agent to track intraday momentum and volume anomalies. The agent uses machine learning to optimize entry and exit timing between the two, leading to consistently strong returns.
3. TECK - Single Agent (15min)
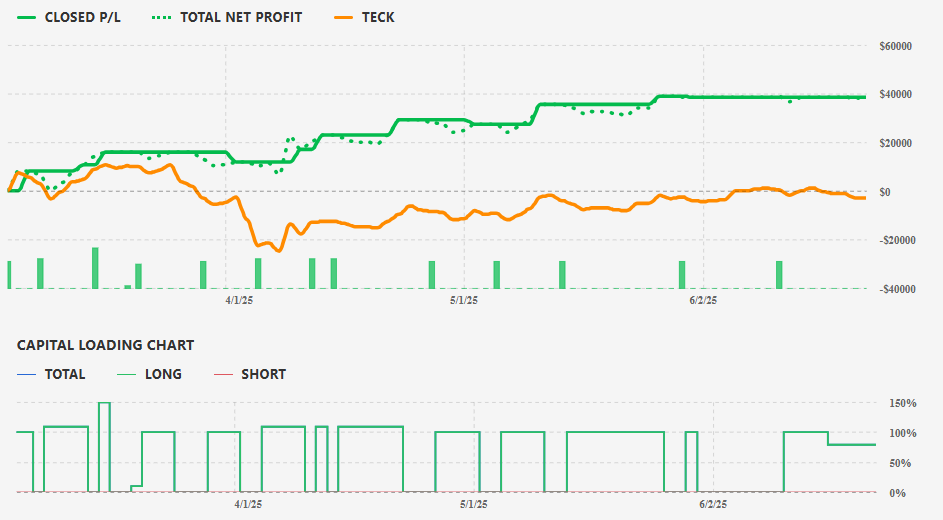
- Annualized Return: +190%
Focused on mining company Teck Resources, this agent employs swing trading strategies within the 15-minute frame. The FLM identifies continuation patterns in commodities-linked equities, capitalizing on both inflation and industrial demand-driven volatility.
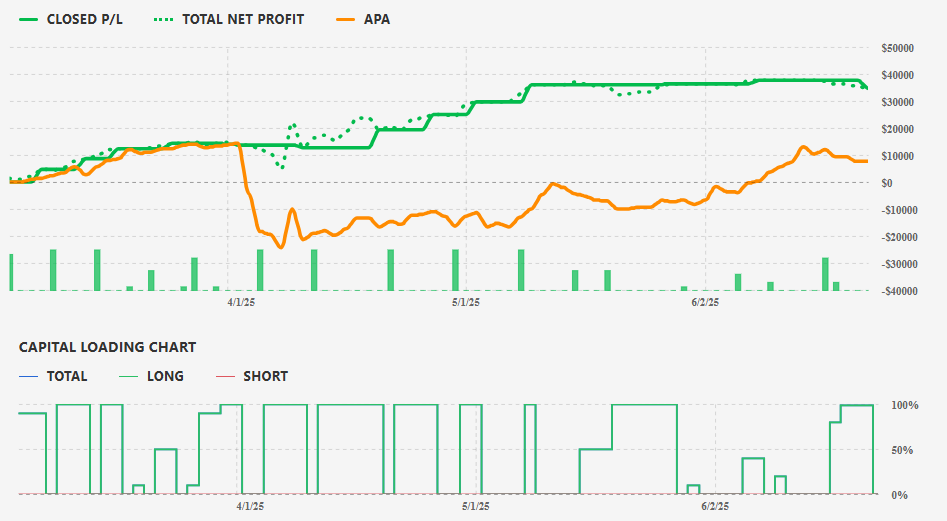
- Annualized Return: +173%
This agent tracks the oil and gas company APA, recognizing breakout and pullback signals on short-term price fluctuations. By filtering noise with FLM technology, the agent reliably enters high-probability trades aligned with broader energy sector movements.
5. APH / SOXS - Double Agent (15min)
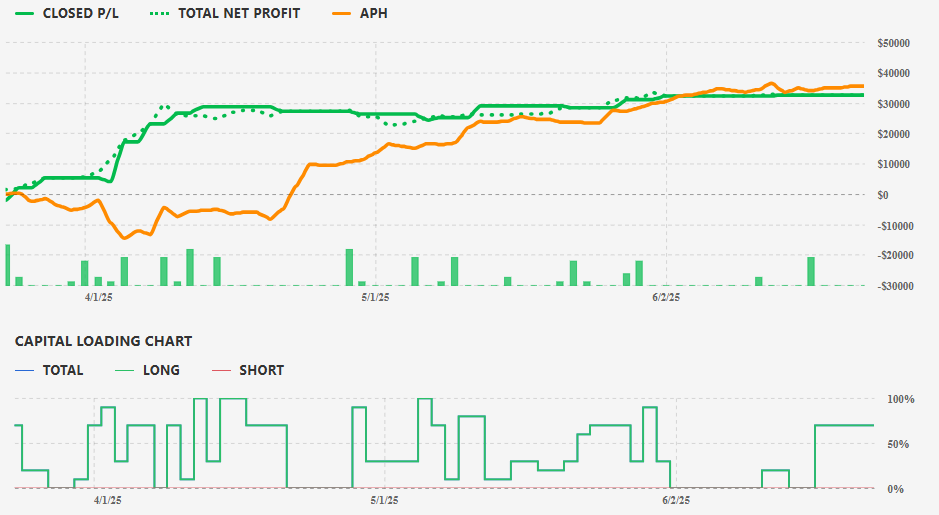
- Annualized Return: +169%
Combining APH (a high-growth tech stock) and SOXS (an inverse ETF), this agent optimizes for volatility. It switches long and short strategies depending on relative strength dynamics and tech sector behavior, guided by Tickeron’s upgraded FLMs.
Understanding Inverse ETFs: A Tactical Trading Tool
Inverse ETFs, like SOXS, are instruments designed to deliver the opposite daily performance of a target index, commonly used for hedging or speculating on market downturns. These tools are highly effective in short-term trading strategies but unsuitable for long-term holding due to daily rebalancing and compounding effects.
Tickeron's AI Double Agents leverage inverse ETFs to hedge trades or profit from sector weakness, all under the watchful eye of adaptive machine learning systems that manage risk and exposure dynamically.
The 15-Minute ML Overview: Smarter Trading in Real Time
A brief 15-minute overview of Tickeron’s FLMs reveals how they synthesize machine learning with technical market indicators to predict trends, filter noise, and automate trade execution. These models constantly ingest real-time data and adjust based on evolving market behavior, providing the following benefits:
- Clear bullish and bearish signals.
- Emotion-free, systematic trade decisions.
- Optimized entry/exit timing.
- Dual signal support for long/short symmetry.
- Tools that are beginner-friendly yet sophisticated enough for advanced users.
Strategic Features and Technical Edge
The AI Trading Agents are built on a blend of robust data science and finance principles. Their key capabilities include:
- 15-Minute Pattern Recognition: Identifies trade signals with high-frequency pattern analytics.
- FLM Trend Filtering: Reduces noise and confirms valid market trends.
- ML Optimization Engine: Continuously fine-tunes strategy execution for maximum efficiency.
- Swing Trading Integration: Holds trades to capture larger price movements, supported by daily timeframe confirmations.
- Automated Risk Controls: Limits exposure to 10 concurrent trades, with real-time monitoring and stop-loss protocols.
Position Management & Risk Control
Tailored for both novices and experienced traders, Tickeron's new FLM agents employ intelligent safeguards:
- Strategic use of the daily chart to avoid overtrading.
- Auto-adjusting to market volatility using adaptive FLMs.
- Simplified dashboard for user control, layered with complex AI-driven analytics under the hood.
This dual-level design allows beginners to build skill and trust while the underlying AI handles the intricate technical analysis.
Tickeron’s Vision: AI-Powered Financial Learning
Under CEO Sergey Savastiouk’s leadership, Tickeron has become a beacon of innovation in AI-assisted trading. Its Financial Learning Models blend machine learning with proprietary technical analysis frameworks, giving users the power to trade with both confidence and clarity.
Tickeron’s ecosystem includes:
- Real-time AI trading robots.
- Double Agents for bullish and bearish perspectives.
- FLMs that evolve with market dynamics.
- Beginner tools and institutional-grade automation in one platform.
Tickeron’s expansion into shorter timeframe trading through enhanced FLMs is not just a technological advancement—it represents a rethinking of how retail and professional traders approach the markets.
Conclusion: A Leap Forward in Adaptive Trading
The June 2025 performance update illustrates the growing impact of AI in reshaping financial strategy. Tickeron’s new 15-minute Virtual Agents, powered by advanced FLMs, are delivering unmatched returns and empowering traders with smarter tools and greater market responsiveness.
With annualized returns reaching up to +270%, these results highlight the efficacy of combining real-time analytics, inverse ETFs, and short-frame machine learning strategies. As AI continues to evolve, so does the potential for individual traders to compete on increasingly level ground with institutional forces.
Aroon Indicator for AMD shows an upward move is likely
AMD's Aroon Indicator triggered a bullish signal on June 29, 2026. Tickeron's A.I.dvisor detected that the AroonUp green line is above 70 while the AroonDown red line is below 30. When the up indicator moves above 70 and the down indicator remains below 30, it is a sign that the stock could be setting up for a bullish move. Traders may want to buy the stock or look to buy calls options. A.I.dvisor looked at 260 similar instances where the Aroon Indicator showed a similar pattern. In of the 260 cases, the stock moved higher in the days that followed. This puts the odds of a move higher at .

Technical Analysis (Indicators)
Bullish Trend Analysis
The Momentum Indicator moved above the 0 level on July 01, 2026. You may want to consider a long position or call options on AMD as a result. In of 76 past instances where the momentum indicator moved above 0, the stock continued to climb. The odds of a continued upward trend are .
Following a 3-day Advance, the price is estimated to grow further. Considering data from situations where AMD advanced for three days, in of 316 cases, the price rose further within the following month. The odds of a continued upward trend are .
Bearish Trend Analysis
The 10-day RSI Indicator for AMD moved out of overbought territory on June 04, 2026. This could be a bearish sign for the stock. Traders may want to consider selling the stock or buying put options. Tickeron's A.I.dvisor looked at 42 similar instances where the indicator moved out of overbought territory. In of the 42 cases, the stock moved lower in the following days. This puts the odds of a move lower at .
The Stochastic Oscillator may be shifting from an upward trend to a downward trend. In of 55 cases where AMD's Stochastic Oscillator exited the overbought zone, the price fell further within the following month. The odds of a continued downward trend are .
The Moving Average Convergence Divergence Histogram (MACD) for AMD turned negative on June 05, 2026. This could be a sign that the stock is set to turn lower in the coming weeks. Traders may want to sell the stock or buy put options. Tickeron's A.I.dvisor looked at 42 similar instances when the indicator turned negative. In of the 42 cases the stock turned lower in the days that followed. This puts the odds of success at .
Following a 3-day decline, the stock is projected to fall further. Considering past instances where AMD declined for three days, the price rose further in of 62 cases within the following month. The odds of a continued downward trend are .
AMD broke above its upper Bollinger Band on May 28, 2026. This could be a sign that the stock is set to drop as the stock moves back below the upper band and toward the middle band. You may want to consider selling the stock or exploring put options.
Fundamental Analysis (Ratings)
The Tickeron Price Growth Rating for this company is (best 1 - 100 worst), indicating outstanding price growth. AMD’s price grows at a higher rate over the last 12 months as compared to S&P 500 index constituents.
The Tickeron Profit vs. Risk Rating rating for this company is (best 1 - 100 worst), indicating low risk on high returns. The average Profit vs. Risk Rating rating for the industry is 65, placing this stock better than average.
The Tickeron PE Growth Rating for this company is (best 1 - 100 worst), pointing to outstanding earnings growth. The PE Growth rating is based on a comparative analysis of stock PE ratio increase over the last 12 months compared against S&P 500 index constituents.
The Tickeron SMR rating for this company is (best 1 - 100 worst), indicating weak sales and an unprofitable business model. SMR (Sales, Margin, Return on Equity) rating is based on comparative analysis of weighted Sales, Income Margin and Return on Equity values compared against S&P 500 index constituents. The weighted SMR value is a proprietary formula developed by Tickeron and represents an overall profitability measure for a stock.
The Tickeron Valuation Rating of (best 1 - 100 worst) indicates that the company is slightly overvalued in the industry. This rating compares market capitalization estimated by our proprietary formula with the current market capitalization. This rating is based on the following metrics, as compared to industry averages: P/B Ratio (13.947) is normal, around the industry mean (21.518). P/E Ratio (183.877) is within average values for comparable stocks, (327.646). Projected Growth (PEG Ratio) (1.327) is also within normal values, averaging (2.056). AMD has a moderately low Dividend Yield (0.000) as compared to the industry average of (0.013). P/S Ratio (24.155) is also within normal values, averaging (60.289).
Notable companies
Industry description
Market Cap
High and low price notable news
Volume
Fundamental Analysis Ratings
The average fundamental analysis ratings, where 1 is best and 100 is worst, are as follows

Advertisement
General Information
a manufacturer of integrated circuits for semiconductors
Industry Semiconductors
Advertisement