


Trading Results for APH/SOXS: Tickeron's AI Double Agent Strategy Provides an Annualized Return of +174%
APH/SOXS Trading Results: +174% Annualized Return with Tickeron’s AI Double Agent Strategy
The financial markets in 2025 are increasingly driven by artificial intelligence, with innovative tools like Tickeron’s AI Trading Double Agent delivering remarkable results. This article explores the performance of the APH/SOXS AI Trading Double Agent, a strategy leveraging a 15-minute timeframe to achieve an impressive annualized return of +174%. By combining Amphenol Corporation (APH) and the Direxion Daily Semiconductor Bear 3x Shares (SOXS), this strategy showcases the power of AI-driven trading in navigating volatile markets.
Amphenol Corporation (APH): A Global Leader in Connectivity
Amphenol Corporation (APH), a global supplier of connectors, sensors, and interconnect systems, holds the second-largest connector market share worldwide. With operations in 40 countries, APH serves diverse end markets, including automotive, broadband, commercial air, industrial, IT, data communications, military, mobile devices, and mobile networks. Its diversified portfolio and global reach have solidified its position as a stable yet dynamic player in the electronics sector. As of June 13, 2025, APH’s stock closed at $69.52, reflecting a modest daily decline of -0.27%, with a trading volume of approximately 3.2 million shares. The stock has shown resilience, gaining 3.1% year-to-date but remains 9.4% below its 52-week high of $78.55 from January 2025. Analysts project robust growth, with a consensus 2025 earnings estimate of $2.68 per share, indicating a 41.8% year-over-year increase, driven by strategic acquisitions like Andrew and Lutze, and rising demand in AI and aerospace sectors.
Direxion Daily Semiconductor Bear 3x Shares (SOXS): A Strategic Hedge
The Direxion Daily Semiconductor Bear 3x Shares (SOXS) is an inverse exchange-traded fund (ETF) designed to deliver three times the inverse daily performance of the PHLX Semiconductor Sector Index. If the index drops by 1%, SOXS aims to rise by approximately 3%, making it an effective tool for hedging or capitalizing on short-term declines in the semiconductor sector. However, its leveraged nature and daily rebalancing make it unsuitable for long-term holding due to decay effects in volatile markets. On June 3, 2025, SOXS’s Momentum Indicator moved below zero, signaling potential bearish momentum, while its 50-day moving average crossed below the 200-day moving average on May 29, 2025, suggesting a longer-term downward trend. Despite these signals, SOXS serves as a critical hedge in the APH/SOXS Double Agent strategy, balancing exposure to semiconductor market volatility.
Why Pair APH with an Inverse ETF like SOXS?
Pairing APH with SOXS, which exhibits a strong negative correlation to the semiconductor sector, creates a balanced trading strategy that mitigates risk while capitalizing on market opportunities. When semiconductor stocks like those in the PHLX Semiconductor Sector Index decline, SOXS typically rises, offsetting potential losses in APH, which is closely tied to the tech and electronics markets. This anti-correlation allows traders to maintain bullish exposure to APH’s long-term growth — driven by AI, aerospace, and communications — while protecting against sector-specific downturns. Tickeron’s AI Double Agent leverages this dynamic, using real-time analytics to switch between bullish APH positions and bearish SOXS positions, optimizing returns in volatile conditions. This approach has proven effective, with similar strategies yielding annualized returns exceeding 100% in 2025.
Tickeron’s AI Trading Agents: Revolutionizing Market Strategies
Tickeron, led by CEO Sergey Savastiouk, is at the forefront of AI-driven trading through its Financial Learning Models (FLMs). These models integrate advanced technical analysis with machine learning to identify market patterns with high precision. The APH/SOXS AI Trading Double Agent combines bullish and bearish signals to provide a balanced trading approach, ideal for both novice and experienced traders. By analyzing real-time data, Tickeron’s agents reduce emotional trading, optimize entry and exit points, and adapt to market shifts. The platform’s user-friendly bots and high-liquidity robots, accessible via Tickeron.com, empower traders with actionable insights, making complex strategies accessible to beginners. On June 17, 2025, Tickeron’s FLMs achieved standout performance, with annualized returns ranging from +250% to +362% across various assets, underscoring their transformative impact.
Strategic Features of the APH/SOXS Double Agent
The APH/SOXS AI Trading Double Agent employs a sophisticated blend of AI and technical analysis to deliver consistent performance. Key features include:
- 15-Minute Pattern Recognition: Entry signals are generated on the 15-minute (M15) chart, leveraging high-frequency pattern analysis for precise trade timing.
- FLM-Based Trend Filtering: Financial Learning Models validate price trends, reducing market noise and enhancing signal accuracy.
- ML-Powered Optimization: Machine learning refines tradeable pattern detection and strategy execution, ensuring optimal performance.
- Smart Swing Trading: The agent holds trades to capture larger market moves, with exit signals confirmed on the daily timeframe for stability.
- Automated Risk Management: The system caps open positions at 10, supported by real-time data monitoring to minimize risk.
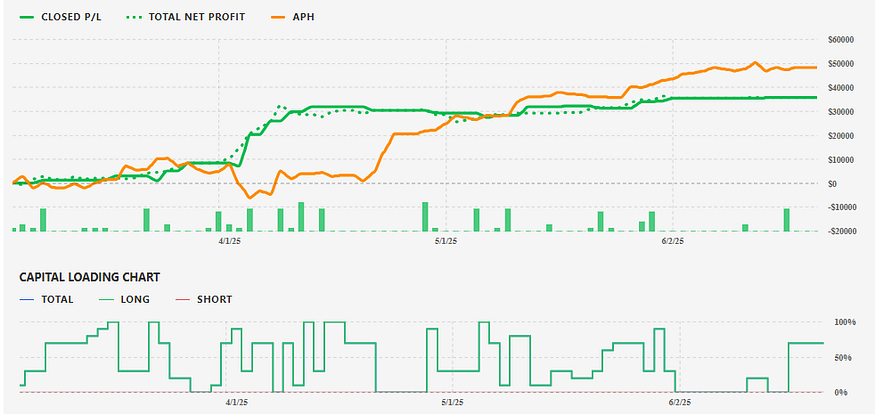
This strategy, accessible via Tickeron’s bot trading platform, has delivered a +174% annualized return, demonstrating its effectiveness in volatile markets.
![]()
Comparison with a Highly Correlated Stock: Molex (MOLX)
Amphenol’s performance can be contextualized by comparing it to Molex (MOLX), another major player in the connector and interconnect systems market. Like APH, Molex benefits from demand in automotive, industrial, and data communications sectors. However, APH’s broader geographic diversification and recent acquisitions, such as Andrew, give it an edge in market share and revenue growth. In Q1 2025, APH reported a 47.7% year-over-year revenue increase to $4,811 million, outpacing Molex’s estimated 32% growth in the same period. While both stocks are highly correlated due to their shared exposure to electronics and AI-driven markets, APH’s stronger financials and analyst targets ($110 by Fox Advisors, $102 by Goldman Sachs) make it a more attractive long-term investment.
Market News Impacting APH and SOXS: June 21, 2025
On June 20, 2025, global markets exhibited mixed performance, influencing assets like APH and SOXS. The Indian Sensex jumped 1,000 points, driven by gains in financial and telecom shares, reflecting optimism in tech-related sectors that could benefit APH. Conversely, UK retail sales plummeted 2.7% in May 2025, the largest decline since December 2023, signaling caution in consumer-driven markets that may indirectly pressure electronics demand. In the U.S., a $2 trillion sell-off raised concerns about a potential 2025 market crash, increasing volatility in semiconductor-related ETFs like SOXS. These dynamics underscore the importance of Tickeron’s AI-driven strategies, which adapt to such market shifts, as seen in the APH/SOXS Double Agent’s ability to balance bullish and bearish positions.
Performance Metrics and Outlook
The APH/SOXS AI Trading Double Agent’s +174% annualized return highlights its ability to navigate volatile markets. APH’s Q1 2025 results, with a 47.7% revenue surge and 34% net profit increase, position it for continued growth, particularly in AI and communications markets. SOXS, despite bearish signals like the May 29, 2025, moving average crossover, remains a vital hedge, with its leveraged structure amplifying gains during semiconductor downturns. Analysts forecast APH’s earnings to reach $3.3 per share by FY 2027, with a revenue CAGR of 11.9% from FY 21–24, reinforcing its long-term potential. For traders, the APH ticker page and Tickeron’s AI tools offer real-time insights to capitalize on these trends.
Viwe more Agents
AI Robots (Signal Agents) P/L
APH — Trading Results AI Trading Agent, 15min +667.70 %
APH / SOXS — Trading Results AI Trading Double Agent, 15min +352.16%
APH / SOXS — Trading Results AI Trading Double Agent, 60min +79.35%
AI Robots (Virtual Agents) P/L
APH — Trading Results AI Trading Agent, 15min +500.01%
APH / SOXS — Trading Results AI Trading Double Agent, 15min +352.17%
APH / SOXS — Trading Results AI Trading Double Agent, 60 min +79.32%
Conclusion
The APH/SOXS AI Trading Double Agent, powered by Tickeron’s Financial Learning Models, exemplifies the future of trading in 2025. By leveraging APH’s growth potential and SOXS’s inverse exposure, this strategy achieves a remarkable +174% annualized return while managing risk through AI-driven analytics. As markets face volatility, as evidenced by recent global sell-offs and sector-specific trends, Tickeron’s tools provide traders with the precision and adaptability needed to succeed. Visit Tickeron.com to explore these innovative strategies and elevate your trading game.
Aroon Indicator for APH shows an upward move is likely
APH's Aroon Indicator triggered a bullish signal on July 02, 2026. Tickeron's A.I.dvisor detected that the AroonUp green line is above 70 while the AroonDown red line is below 30. When the up indicator moves above 70 and the down indicator remains below 30, it is a sign that the stock could be setting up for a bullish move. Traders may want to buy the stock or look to buy calls options. A.I.dvisor looked at 326 similar instances where the Aroon Indicator showed a similar pattern. In of the 326 cases, the stock moved higher in the days that followed. This puts the odds of a move higher at .

Technical Analysis (Indicators)
Bullish Trend Analysis
The 10-day moving average for APH crossed bullishly above the 50-day moving average on June 02, 2026. This indicates that the trend has shifted higher and could be considered a buy signal. In of 15 past instances when the 10-day crossed above the 50-day, the stock continued to move higher over the following month. The odds of a continued upward trend are .
Following a 3-day Advance, the price is estimated to grow further. Considering data from situations where APH advanced for three days, in of 356 cases, the price rose further within the following month. The odds of a continued upward trend are .
Bearish Trend Analysis
The 10-day RSI Indicator for APH moved out of overbought territory on July 01, 2026. This could be a bearish sign for the stock. Traders may want to consider selling the stock or buying put options. Tickeron's A.I.dvisor looked at 53 similar instances where the indicator moved out of overbought territory. In of the 53 cases, the stock moved lower in the following days. This puts the odds of a move lower at .
The Stochastic Oscillator may be shifting from an upward trend to a downward trend. In of 68 cases where APH's Stochastic Oscillator exited the overbought zone, the price fell further within the following month. The odds of a continued downward trend are .
Following a 3-day decline, the stock is projected to fall further. Considering past instances where APH declined for three days, the price rose further in of 62 cases within the following month. The odds of a continued downward trend are .
APH broke above its upper Bollinger Band on June 30, 2026. This could be a sign that the stock is set to drop as the stock moves back below the upper band and toward the middle band. You may want to consider selling the stock or exploring put options.
Fundamental Analysis (Ratings)
The Tickeron Price Growth Rating for this company is (best 1 - 100 worst), indicating outstanding price growth. APH’s price grows at a higher rate over the last 12 months as compared to S&P 500 index constituents.
The Tickeron Profit vs. Risk Rating rating for this company is (best 1 - 100 worst), indicating low risk on high returns. The average Profit vs. Risk Rating rating for the industry is 61, placing this stock better than average.
The Tickeron SMR rating for this company is (best 1 - 100 worst), indicating very strong sales and a profitable business model. SMR (Sales, Margin, Return on Equity) rating is based on comparative analysis of weighted Sales, Income Margin and Return on Equity values compared against S&P 500 index constituents. The weighted SMR value is a proprietary formula developed by Tickeron and represents an overall profitability measure for a stock.
The Tickeron PE Growth Rating for this company is (best 1 - 100 worst), pointing to average earnings growth. The PE Growth rating is based on a comparative analysis of stock PE ratio increase over the last 12 months compared against S&P 500 index constituents.
The Tickeron Seasonality Score of (best 1 - 100 worst) indicates that the company is fair valued in the industry. The Tickeron Seasonality score describes the variance of predictable price changes around the same period every calendar year. These changes can be tied to a specific month, quarter, holiday or vacation period, as well as a meteorological or growing season.
The Tickeron Valuation Rating of (best 1 - 100 worst) indicates that the company is slightly overvalued in the industry. This rating compares market capitalization estimated by our proprietary formula with the current market capitalization. This rating is based on the following metrics, as compared to industry averages: P/B Ratio (14.599) is normal, around the industry mean (7.839). P/E Ratio (47.690) is within average values for comparable stocks, (94.432). Projected Growth (PEG Ratio) (1.421) is also within normal values, averaging (1.454). Dividend Yield (0.005) settles around the average of (0.010) among similar stocks. P/S Ratio (8.224) is also within normal values, averaging (6.332).
Notable companies
Industry description
Market Cap
High and low price notable news
Volume
Fundamental Analysis Ratings
The average fundamental analysis ratings, where 1 is best and 100 is worst, are as follows

Advertisement
General Information
a manufacturer of electrical, electronic & fiber optic connectors, coaxial and flat-ribbon cable and interconnect systems
Industry ElectronicComponents
Advertisement