


Western Alliance (WAL) July 17 Q2 Preview: Key Expectations with Tickeron's High-Volatility AI Bot
As the Q2 2025 earnings season progresses through July 14-18, regional banks like Western Alliance Bancorporation (WAL) are under scrutiny for insights into deposit trends, loan growth, and interest rate impacts. On Thursday, July 17, 2025, (WAL) will release its results before the market opens, followed by a conference call to discuss performance.
This preview highlights key projections, recent developments, and implications for (WAL), based on analyst consensus and market context. With focus on net interest income (NII) and asset quality, a strong report could signal resilience in commercial banking. However, earnings volatility—often amplified in regional lenders—creates trading challenges. Tickeron's AI Trading Bots, leveraging advanced Financial Learning Models (FLMs), provide a solution, with one bot specifically designed for high-volatility scenarios like those post-earnings.
Earnings Preview: What to Expect from Western Alliance Bancorporation's Q2 Report
Western Alliance Bancorporation (WAL), a diversified financial services firm with strengths in commercial real estate and technology lending, has shown recovery momentum in 2025 amid stabilizing deposits. Analysts anticipate Q2 EPS of $2.02, reflecting a year-over-year increase on higher revenues, driven by NII growth and fee income. Revenue estimates point to continued expansion, with annual forecasts for 10% growth, supported by earnings rising 17.6% per annum.
Recent news includes initiatives in affordable housing and cybersecurity, positioning (WAL) for niche growth, though the stock has underperformed peers, down about 5% year-to-date as of early July. Q1 results exceeded expectations with deposit inflows, and Q2 should benefit from similar trends amid easing rate pressures. Essential metrics to watch:
- Net Interest Income (NII): Expected uplift from loan portfolio expansion and stable funding costs, a key driver for regional banks.
- Asset Quality and Provisions: Credit loss reserves will gauge exposure to commercial real estate; improvements could boost confidence.
- Fee Income and Efficiency: Growth in non-interest revenues from advisory services; expense controls to maintain margins.
- Guidance and Broader Effects: Upward revisions in FY2025 outlook (EPS growth ~16.9%) could counter underperformance, influencing mid-cap bank sentiment.
These factors make (WAL)'s report a gauge for regional banking health. Yet, post-earnings swings demand precise tools—enter AI for automated, data-driven trades.
Turning Earnings Volatility into Opportunity with Tickeron's AI Trading Bots
Earnings reports like (WAL)'s can ignite volatility, ideal for price action strategies but risky manually. Tickeron's AI Trading Bots, powered by proprietary Financial Learning Models (FLMs), analyze price, volume, sentiment, and indicators to deliver adaptive signals, thriving in such conditions.
The June 23, 2025 breakthrough introduced AI Agents with 15- and 5-minute ML frames, surpassing 60-minute norms for faster intraday responses. Tests confirm better timing in rapid moves, as CEO Sergey Savastiouk, Ph.D., stated: "Our 15- and 5-minute ML cycles deliver unprecedented precision, empowering traders with tools previously exclusive to institutional investors." Now available, they democratize AI through real-time analytics and strategies.
For volatile stocks like (WAL), the Day Trader: Price Action for Long Position with High Volatility for Medium and High Liquidity Stocks, 60 min, (TA). Signal Agent excels. Beginner-friendly, it uses technical analysis (TA) to target high-volatility dips in liquid names, focusing on long-biased trades for simplicity.
Core Strategy: Harnessing Price Action in Volatile Markets
This bot activates post-8% volatility surges, entering during corrections under the reversal assumption. It scans 60-min charts for support/resistance via price action and indicators, prioritizing long positions to align with upward trends while handling intraday shorts (closed same-day to avoid overnight risks).
Key elements:
- Volatility Trigger: Trades only in heightened conditions, capturing recoveries for optimal entries.
- Trend Bias: Long-focused for pullback buys in uptrends; shorts for downtrends but with quick exits.
- Technical Foundation: Relies on price patterns, no fundamentals, for objective, data-driven decisions.
This pure price action approach suits beginners, emphasizing infrequent (about 43 trades/period) but timed opportunities.
Position and Risk Management: Built for Safety and Recovery
Risk is central, with features minimizing losses:
- Stops and Profits: Fast stop-loss (2-15% risk/trade); take-profits at ~4% longs, 7% shorts—locking gains swiftly.
- Drawdown Handling: Up to 25% drawdowns recoverable via market corrections, preserving capital.
- Position Limits: Low max opens (16) for focused management; high diversification across sectors.
All without margin, promoting realistic, controlled trading.
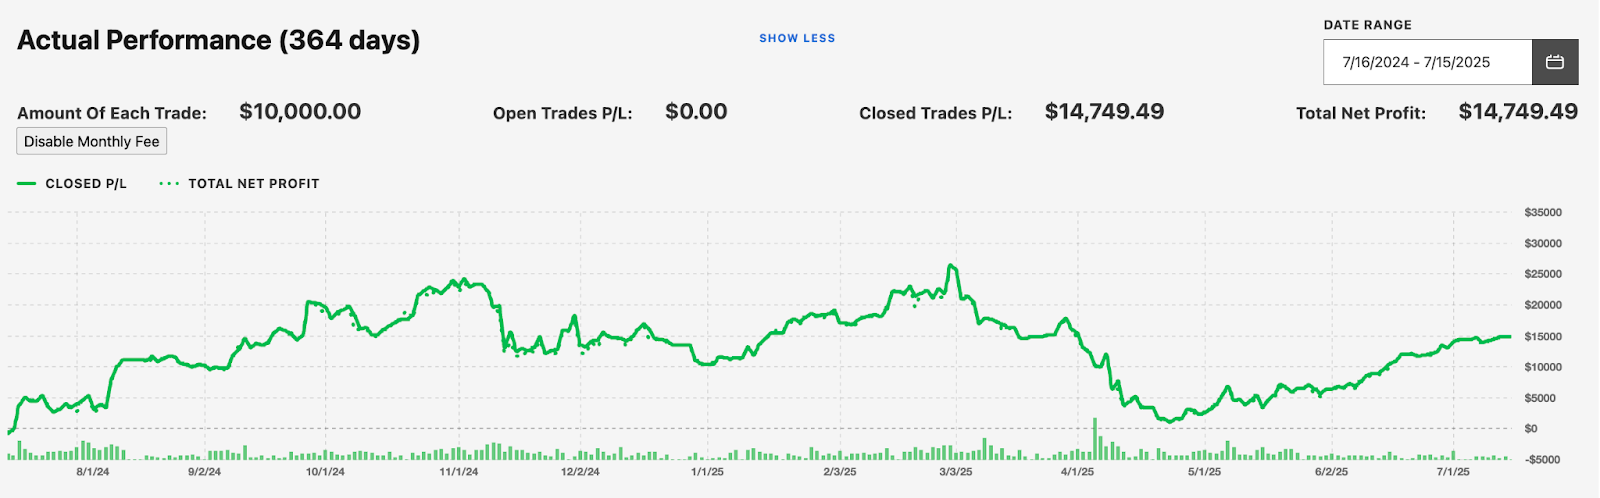
Performance Highlights: Reliability in High Volatility
Over 364 days at $10,000/trade, it generated $14,749.49 net profit (post-fees), a 13.83% annualized return. Of 1,958 trades, 1,151 profitable (58.78% win rate), averaging $242.68 gains vs. $326.51 losses—profit factor 1.06. Sharpe ratio 0.15; profit/drawdown 0.58 (rated high); 21 consecutive wins ($5,910.76). Longs won 60.49%; 8-hour average duration for day trading efficiency. Stats from real-time Morningstar data, no bias.
Optimal in medium volatility, with tabs for open/closed trades and stats. Access: Day Trader: Price Action for Long Position with High Volatility for Medium and High Liquidity Stocks, 60 min, (TA).
Why Price Action AI Trading Bots Surpass Manual Trading During Earnings
For (WAL)'s earnings, manual price watching invites errors. This bot automates via FLMs: detecting surges, entering reversals, managing risks—yielding steady wins (over 58%) in volatility. Advantages:
- Consistency: High win rate and quick durations capture earnings pops without overnight holds.
- Beginner Ease: Structured risk (fast stops) and long bias reduce complexity.
- Resilience: High diversification/profit/drawdown hedges dips; medium volatility balance.
- Advancement: New ML frames improve intraday precision, as tests show—key for post-report moves.
Whether eyeing (WAL)'s NII growth or credit trends, this bot empowers efficient trades. Visit Tickeron for demos, stats, and trials. In volatile times, let AI handle the action.
WAL's MACD Histogram just turned positive
The Moving Average Convergence Divergence (MACD) for WAL turned positive on June 29, 2026. Looking at past instances where WAL's MACD turned positive, the stock continued to rise in of 46 cases over the following month. The odds of a continued upward trend are .

Technical Analysis (Indicators)
Bullish Trend Analysis
The Momentum Indicator moved above the 0 level on June 30, 2026. You may want to consider a long position or call options on WAL as a result. In of 78 past instances where the momentum indicator moved above 0, the stock continued to climb. The odds of a continued upward trend are .
WAL moved above its 50-day moving average on June 23, 2026 date and that indicates a change from a downward trend to an upward trend.
Following a 3-day Advance, the price is estimated to grow further. Considering data from situations where WAL advanced for three days, in of 283 cases, the price rose further within the following month. The odds of a continued upward trend are .
The Aroon Indicator entered an Uptrend today. In of 240 cases where WAL Aroon's Indicator entered an Uptrend, the price rose further within the following month. The odds of a continued Uptrend are .
Bearish Trend Analysis
The Stochastic Oscillator has been in the overbought zone for 1 day. Expect a price pull-back in the near future.
Following a 3-day decline, the stock is projected to fall further. Considering past instances where WAL declined for three days, the price rose further in of 62 cases within the following month. The odds of a continued downward trend are .
WAL broke above its upper Bollinger Band on June 12, 2026. This could be a sign that the stock is set to drop as the stock moves back below the upper band and toward the middle band. You may want to consider selling the stock or exploring put options.
Fundamental Analysis (Ratings)
The Tickeron SMR rating for this company is (best 1 - 100 worst), indicating very strong sales and a profitable business model. SMR (Sales, Margin, Return on Equity) rating is based on comparative analysis of weighted Sales, Income Margin and Return on Equity values compared against S&P 500 index constituents. The weighted SMR value is a proprietary formula developed by Tickeron and represents an overall profitability measure for a stock.
The Tickeron Seasonality Score of (best 1 - 100 worst) indicates that the company is slightly undervalued in the industry. The Tickeron Seasonality score describes the variance of predictable price changes around the same period every calendar year. These changes can be tied to a specific month, quarter, holiday or vacation period, as well as a meteorological or growing season.
The Tickeron Valuation Rating of (best 1 - 100 worst) indicates that the company is fair valued in the industry. This rating compares market capitalization estimated by our proprietary formula with the current market capitalization. This rating is based on the following metrics, as compared to industry averages: P/B Ratio (1.175) is normal, around the industry mean (1.302). P/E Ratio (9.169) is within average values for comparable stocks, (17.714). WAL's Projected Growth (PEG Ratio) (0.000) is slightly lower than the industry average of (1.913). Dividend Yield (0.021) settles around the average of (0.032) among similar stocks. P/S Ratio (2.317) is also within normal values, averaging (3.755).
The Tickeron Price Growth Rating for this company is (best 1 - 100 worst), indicating fairly steady price growth. WAL’s price grows at a lower rate over the last 12 months as compared to S&P 500 index constituents.
The Tickeron PE Growth Rating for this company is (best 1 - 100 worst), pointing to average earnings growth. The PE Growth rating is based on a comparative analysis of stock PE ratio increase over the last 12 months compared against S&P 500 index constituents.
The Tickeron Profit vs. Risk Rating rating for this company is (best 1 - 100 worst), indicating that the returns do not compensate for the risks. WAL’s unstable profits reported over time resulted in significant Drawdowns within these last five years. A stable profit reduces stock drawdown and volatility. The average Profit vs. Risk Rating rating for the industry is 60, placing this stock worse than average.
Notable companies
Industry description
Market Cap
High and low price notable news
Volume
Fundamental Analysis Ratings
The average fundamental analysis ratings, where 1 is best and 100 is worst, are as follows

Advertisement
General Information
a regional bank
Industry RegionalBanks
Advertisement