Real-time pattern trading is a smart way to find entry and exit prices if you can scan thousands of stocks and ETFs within minutes. It is definitely impossible for humans. Artificial Intelligence (A.I.) not only discovers these patterns, but also checks if they worked out well in the past. Knowing the success rate in the past allows A.I. to establish the odds of success in the future.
The Descending Triangle pattern has a horizontal bottom (1, 3, 5) which represents the support level, and a down-sloping top line (2, 4). The breakout can be either up or down and the direction of the breakout determines which corresponding price level is the target.
This pattern is commonly associated with directionless markets since the contraction (narrowing) of the market range signals that neither bulls nor bears are in control. When the price of a security consolidates in a somewhat volatile fashion, it may indicate growing investor concern that the price is set to break out.
If the price breaks out from the bottom pattern boundary, day traders and swing traders should trade with the DOWN trend. Consider selling the security short or buying a put option at the downward breakout price level. To identify an exit, compute the target price, by subtracting the pattern height from the breakout point. For downward breakouts the breakout level is the bottom horizontal line (1, 3, 5). Pattern height is the difference between the level of the bottom horizontal line and the highest high.
To limit potential loss when price suddenly goes in the wrong direction, consider placing a stop order to buy back a short position or sell a put option at or above the breakout price.
Time frames No matter your trading strategy (day trading, swing, etc), we have patterns that will be ready to trade.
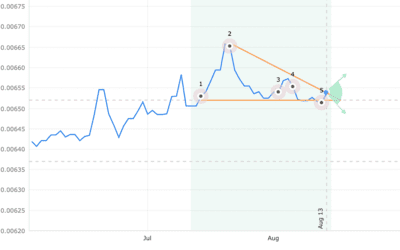
JPYGBP - Japan Yen - United Kingdom Pound
| STATUS | Emerged |
|---|---|
| CURRENT CONFIDENCE | 47% |
| TARGET (EXIT) PRICE | 0.006520 GBP |
| BREAKOUT (ENTRY) PRICE | 0.006370 GBP |
| DISTANCE TO TARGET PRICE | 2.90% (19.0 pips) |
| EMERGED ON | Aug 12, closing price |
| WITH CONFIDENCE LEVEL | 55% |
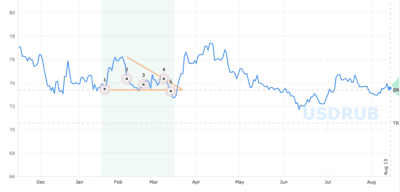
USDRUB - United States Dollar - Russia Ruble
| STATUS | Emerged |
|---|---|
| CURRENT CONFIDENCE | 54% |
| TARGET (EXIT) PRICE | 73.393730 RUB |
| BREAKOUT (ENTRY) PRICE | 70.566971 RUB |
| DISTANCE TO TARGET PRICE | 3.70% (270.9 pips) |
| EMERGED ON | Mar 12, closing price |
| WITH CONFIDENCE LEVEL | 0% |
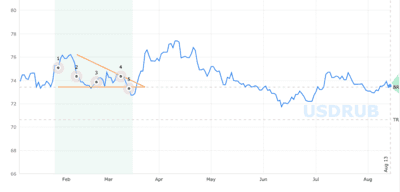
USDRUB - United States Dollar - Russia Ruble
| STATUS | Emerged |
|---|---|
| CURRENT CONFIDENCE | 57% |
| TARGET (EXIT) PRICE | 73.436432 RUB |
| BREAKOUT (ENTRY) PRICE | 70.652367 RUB |
| DISTANCE TO TARGET PRICE | 3.58% (262.3 pips) |
| EMERGED ON | Mar 12, closing price |
| WITH CONFIDENCE LEVEL | 0% |
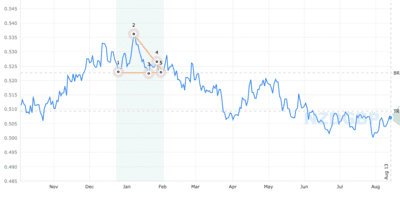
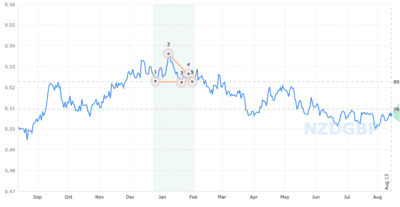
NZDGBP - New Zealand Dollar - United Kingdom Pound
| STATUS | Emerged |
|---|---|
| CURRENT CONFIDENCE | 57% |
| TARGET (EXIT) PRICE | 0.522720 GBP |
| BREAKOUT (ENTRY) PRICE | 0.509390 GBP |
| DISTANCE TO TARGET PRICE | Target reached |
| EMERGED ON | Jan 31, closing price |
| WITH CONFIDENCE LEVEL | 0% |
NZDGBP - New Zealand Dollar - United Kingdom Pound
| STATUS | Emerged |
|---|---|
| CURRENT CONFIDENCE | 56% |
| TARGET (EXIT) PRICE | 0.522720 GBP |
| BREAKOUT (ENTRY) PRICE | 0.509390 GBP |
| DISTANCE TO TARGET PRICE | Target reached |
| EMERGED ON | Jan 31, closing price |
| WITH CONFIDENCE LEVEL | 0% |