Screener of Stock Bearish Broadening Bottom
AI Pattern Search Engine (PSE)
Operating the Pattern Search Engine is easy and straightforward
- Set up pattern search criteria
- Receive patterns in your feed
- Bookmark patterns to track their status
How It Works
Trading patterns is one of the most sophisticated trading strategies. It exploits the psychology of market participants, and takes advantage of the knowledge of market insights.If you want to use AI to discover these hidden effects, then Tickeron’s Pattern Search Engine is the tool you need. Using PSE, AI will teach you to recognize patterns and entry and exit points.
Pattern Types and Stats


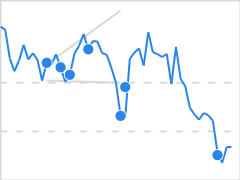
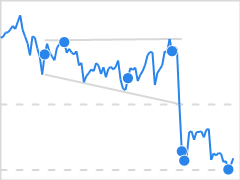
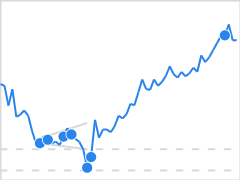
Broadening Bottom


The Broadening Bottom pattern forms when a security price makes higher highs (2, 4) and lower lows (1, 3, 5) following two widening trend lines. The price is expected to move up or down past the pattern depending on which line is broken first. What distinguishes a Broadening Bottom from a Broadening Top is that the price of the security is declining prior to entering the pattern formation.
This type of formation happens when volatility is high or increasing, and when a security's price is moving with high volatility but or no direction. It potentially indicates growing investor nervousness and a little indecisiveness.
Trade Idea
If the price breaks out from the bottom pattern boundary, day traders and swing traders should trade with a DOWN trend. Consider selling the security short or buying a put option at the downward breakout price level. To identify an exit, compute the Target Price by subtracting the pattern height from the breakout point. Pattern height is a difference between patterns highest high and its lowest low.
To limit potential loss when price suddenly goes in the wrong direction, consider placing a stop order to buy back a short position or sell a put option at or above the breakout price.