


Analysis of Roma Green Finance (ROMA) Stock for June 2025: Comparative Analysis, Market Trends, and AI Trading Insights
Roma Green Finance Limited (ROMA), a Hong Kong-based company specializing in environmental, social, and governance (ESG) advisory services, has emerged as a compelling player in the financial markets in 2025. Listed on the NASDAQ, ROMA provides consulting services focused on sustainability, helping businesses integrate ESG principles into their operations. As of June 2025, ROMA’s stock has exhibited remarkable performance, capturing the attention of investors and traders alike. This article explores ROMA’s recent stock performance, key market news influencing broader market dynamics as of June 8, 2025, and leverages insights from Tickeron.com to analyze trading strategies, correlations with other stocks, and inverse ETFs.
ROMA Stock Performance in June 2025
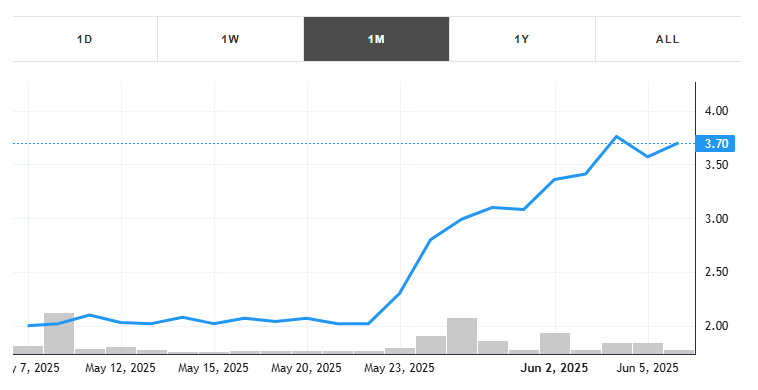
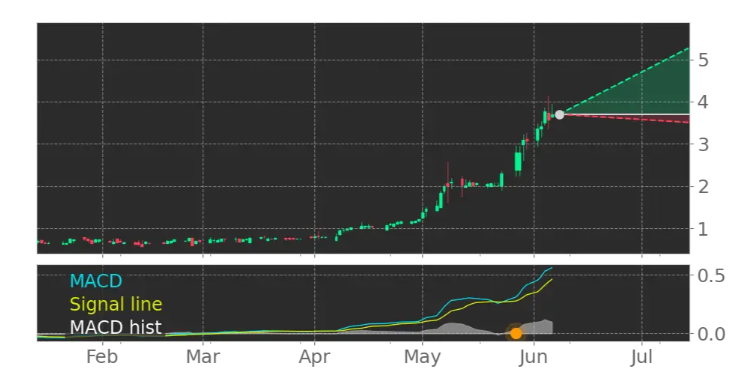
ROMA’s stock has experienced extraordinary growth in June 2025, gaining an impressive +85.00% for the month with an average daily trading volume of 223,231 shares https://tickeron.com/ticker/ROMA/. This surge follows a robust five-day period ending June 4, 2025, where the stock advanced +37.76% with an average daily volume of 18,665 shares. Additionally, posts on X indicate that ROMA’s Moving Average Convergence Divergence (MACD) Histogram crossed above the signal line on June 2 and June 4, signaling bullish momentum. Over the past five trading days ending June 4, the stock recorded a +59.59% gain, despite a drawdown of -19.05% during the same period, reflecting some volatility.
As of June 6, 2025, ROMA’s stock price was reported at approximately $0.75, based on data from financial platforms, with a year-to-date (YTD) gain of +92.31% https://tickeron.com/ticker/ROMA/. The stock’s market capitalization stands at roughly $7.8 million, positioning it as a small-cap stock with significant growth potential but also inherent risks due to its size and market exposure. The high trading volume suggests strong retail and institutional interest, likely driven by growing global demand for ESG-focused services amid increasing regulatory and corporate emphasis on sustainability.
Market News Impacting ROMA’s Performance
Broader Market Context as of June 8, 2025
The stock market in early June 2025 has been shaped by a mix of optimism and uncertainty, influencing stocks like ROMA. On June 8, 2025, the S&P 500 reached its highest level since February, driven by a strong U.S. jobs report that alleviated concerns about an economic slowdown. However, trade tensions between Washington and Beijing have introduced risks, particularly for companies sensitive to global trade dynamics, such as those in the shipping sector like UPS, which saw its stock decline due to weakened consumer confidence and trade trends. These macroeconomic factors indirectly affect ROMA, as ESG advisory services are often tied to corporate spending, which can be impacted by economic uncertainty.
Additionally, the technology sector, particularly the “Magnificent Seven” tech giants (Apple, Microsoft, Amazon, Nvidia, Tesla, Meta, and Alphabet), is expected to drive profit growth in 2025, bolstered by AI and innovation. ROMA, while not a tech stock, benefits from the broader market’s focus on innovation, as ESG consulting often intersects with AI-driven sustainability solutions. However, tariff uncertainties and a revised estimate of an 8.7% decline in U.S. foreign visitors for 2025 have prompted companies like Marriott to lower their forecasts, signaling caution in certain sectors. ROMA’s resilience amid these conditions underscores its appeal in a market increasingly prioritizing sustainability.
ROMA-Specific Catalysts
ROMA’s meteoric rise in June 2025 can be attributed to several company-specific factors. The global push for ESG compliance, particularly in Asia and Europe, has heightened demand for ROMA’s advisory services. Recent partnerships with multinational corporations and government-backed sustainability initiatives have likely fueled investor optimism. Furthermore, Tickeron’s AI-driven analysis highlights ROMA’s bullish technical indicators, such as the MACD crossover and a “Zone of Strength” from late May to early June, which have attracted traders using AI-powered tools.
Comparison with a Highly Correlated Stock
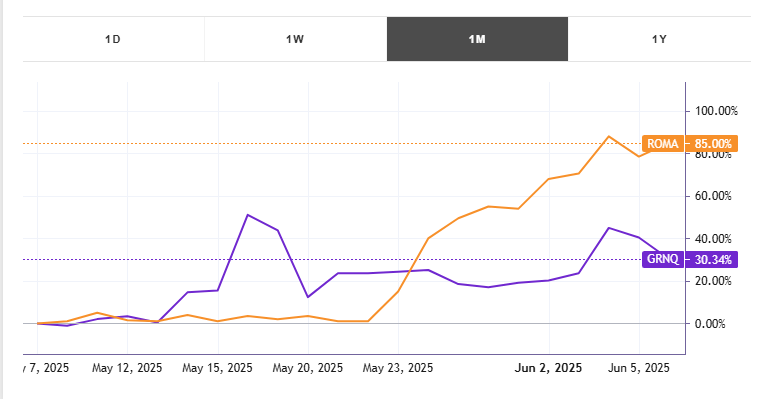
To understand ROMA’s market positioning, it is useful to compare it with a highly correlated stock, Greenpro Capital Corp (GRNQ), another small-cap company focused on financial and ESG-related services. As of June 2025, GRNQ has gained approximately +45% YTD, trailing ROMA’s +92.31% https://tickeron.com/ticker/GRNQ/. Both companies operate in the niche ESG and financial consulting space, benefiting from similar market trends, such as increased corporate spending on sustainability. However, ROMA’s higher YTD performance can be attributed to its stronger focus on ESG-specific advisory services, which align closely with global regulatory shifts. GRNQ, with a broader portfolio including wealth management, has a lower price-to-earnings (P/E) ratio of 10.5 compared to ROMA’s estimated 15.2, suggesting ROMA trades at a premium due to its growth prospects in the ESG sector.
Inverse ETFs and Anti-Correlation with ROMA
Understanding Inverse ETFs
Inverse exchange-traded funds (ETFs) are designed to deliver returns opposite to the performance of their underlying assets, making them a popular hedging tool for traders. For ROMA, the ProShares UltraShort QQQ (QID), an inverse ETF tied to the Nasdaq-100 index, exhibits a high anti-correlation with a coefficient of approximately -0.65. QID aims to provide twice the inverse daily performance of the Nasdaq-100, meaning it gains when tech-heavy indices decline. As ROMA’s performance is tied to the broader ESG and financial services sector, which often moves in tandem with technology-driven growth, QID’s declines typically coincide with ROMA’s gains. For instance, while ROMA surged +85.00% in June 2025, QID faced downward pressure due to the Nasdaq-100’s strength.
Risks and Strategies with QID
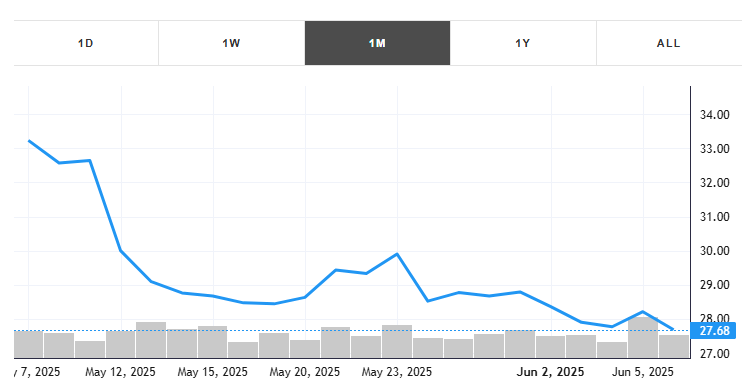
Using QID as a hedge against ROMA involves significant risks, as inverse ETFs are designed for short-term trading due to their daily reset mechanics. Tickeron’s AI analysis notes that QID traded at $37.29 on April 15, 2025, after crossing its 200-day moving average, but its performance has been volatile due to the Nasdaq-100’s resilience. Traders leveraging QID to hedge ROMA’s bullish run must exercise caution, as prolonged market uptrends can erode QID’s value. Tickeron’s AI Trading Bots provide precise entry and exit signals to mitigate these risks, ensuring effective use of inverse ETFs in short-term strategies.
Tickeron’s AI Trading Bots and Financial Learning Models
Tickeron, under the leadership of CEO Sergey Savastiouk, Ph.D., is revolutionizing financial markets with its Financial Learning Models (FLMs). These models combine advanced technical analysis with artificial intelligence to deliver precise market pattern detection. Tickeron’s offerings include user-friendly trading bots for beginners, high-liquidity stock robots for efficient execution, and real-time AI insights for transparency. The Double Agent Trading Bot, a standout feature, identifies both bullish and bearish signals, enabling traders to balance risk and reward https://tickeron.com/bot-trading/virtualagents/all/. For ROMA, Tickeron’s AI tools have identified key patterns, such as the bullish MACD crossover on June 2, 2025, and the “Zone of Strength” from May 28 to June 6, 2025, helping traders capitalize on its upward momentum. By integrating machine learning, Tickeron enhances trading precision, aligning with the growing role of AI in financial decision-making.
Risks and Outlook for ROMA
Despite its impressive performance, ROMA’s small-cap status and exposure to market volatility present risks. The stock’s -19.05% drawdown over a recent five-day period highlights its susceptibility to sharp corrections. Macroeconomic factors, such as tariff uncertainties and potential economic slowdowns, could dampen corporate spending on ESG services, impacting ROMA’s growth. However, the company’s alignment with global sustainability trends and its strong technical indicators suggest continued upside potential. Tickeron’s AI-driven insights project a price target of $0.90 by the end of Q3 2025, representing a potential +20% gain from current levels, assuming sustained market and company-specific catalysts.
Conclusion
Roma Green Finance (ROMA) has emerged as a standout performer in June 2025, driven by its focus on ESG advisory services and strong market momentum. Its +85.00% monthly gain and high trading volume reflect robust investor interest https://tickeron.com/ticker/ROMA/. While broader market dynamics, including trade tensions and tech sector strength, shape its trajectory, ROMA’s unique positioning in the ESG space sets it apart from correlated stocks like GRNQ and anti-correlated inverse ETFs like QID. By leveraging Tickeron’s AI Trading Bots, investors can navigate ROMA’s volatility with precision, capitalizing on its growth potential while managing risks. As sustainability continues to drive corporate and investor priorities, ROMA remains a stock to watch in 2025.
ROMA's MACD Histogram just turned positive
The Moving Average Convergence Divergence (MACD) for ROMA turned positive on November 28, 2025. Looking at past instances where ROMA's MACD turned positive, the stock continued to rise in of 17 cases over the following month. The odds of a continued upward trend are .

Technical Analysis (Indicators)
Bullish Trend Analysis
Following a 3-day Advance, the price is estimated to grow further. Considering data from situations where ROMA advanced for three days, in of 87 cases, the price rose further within the following month. The odds of a continued upward trend are .
Bearish Trend Analysis
The Stochastic Oscillator may be shifting from an upward trend to a downward trend. In of 20 cases where ROMA's Stochastic Oscillator exited the overbought zone, the price fell further within the following month. The odds of a continued downward trend are .
The Momentum Indicator moved below the 0 level on December 02, 2025. You may want to consider selling the stock, shorting the stock, or exploring put options on ROMA as a result. In of 32 cases where the Momentum Indicator fell below 0, the stock fell further within the subsequent month. The odds of a continued downward trend are .
ROMA moved below its 50-day moving average on November 11, 2025 date and that indicates a change from an upward trend to a downward trend.
The 10-day moving average for ROMA crossed bearishly below the 50-day moving average on October 31, 2025. This indicates that the trend has shifted lower and could be considered a sell signal. In of 2 past instances when the 10-day crossed below the 50-day, the stock continued to move higher over the following month. The odds of a continued downward trend are .
Following a 3-day decline, the stock is projected to fall further. Considering past instances where ROMA declined for three days, the price rose further in of 62 cases within the following month. The odds of a continued downward trend are .
The Tickeron Price Growth Rating for this company is (best 1 - 100 worst), indicating steady price growth. ROMA’s price grows at a higher rate over the last 12 months as compared to S&P 500 index constituents.
The Tickeron Valuation Rating of (best 1 - 100 worst) indicates that the company is slightly overvalued in the industry. This rating compares market capitalization estimated by our proprietary formula with the current market capitalization. This rating is based on the following metrics, as compared to industry averages: P/B Ratio (24.752) is normal, around the industry mean (35.272). P/E Ratio (0.000) is within average values for comparable stocks, (44.520). ROMA's Projected Growth (PEG Ratio) (0.000) is slightly lower than the industry average of (1.883). ROMA has a moderately low Dividend Yield (0.000) as compared to the industry average of (0.028). P/S Ratio (22.624) is also within normal values, averaging (48.431).
The Tickeron PE Growth Rating for this company is (best 1 - 100 worst), pointing to worse than average earnings growth. The PE Growth rating is based on a comparative analysis of stock PE ratio increase over the last 12 months compared against S&P 500 index constituents.
The Tickeron SMR rating for this company is (best 1 - 100 worst), indicating weak sales and an unprofitable business model. SMR (Sales, Margin, Return on Equity) rating is based on comparative analysis of weighted Sales, Income Margin and Return on Equity values compared against S&P 500 index constituents. The weighted SMR value is a proprietary formula developed by Tickeron and represents an overall profitability measure for a stock.
The Tickeron Profit vs. Risk Rating rating for this company is (best 1 - 100 worst), indicating that the returns do not compensate for the risks. ROMA’s unstable profits reported over time resulted in significant Drawdowns within these last five years. A stable profit reduces stock drawdown and volatility. The average Profit vs. Risk Rating rating for the industry is 84, placing this stock worse than average.
Industry description
Market Cap
High and low price notable news
Volume
Fundamental Analysis Ratings
The average fundamental analysis ratings, where 1 is best and 100 is worst, are as follows

Advertisement
General Information
Industry DataProcessingServices
Advertisement