


AST SpaceMobile’s 211% Rally: A Full Breakdown of ASTS’s April–July 2025 Surge
The satellite telecommunications sector witnessed one of the most remarkable stock performances in 2025 as AST SpaceMobile, Inc. (ASTS) delivered an extraordinary 211% gain from its April 7 low of $18.22 to its July 21 closing price of $56.67. This dramatic surge has propelled the company's market capitalization to approximately $19.8 billion, making it one of the year's most spectacular growth stories and cementing AST SpaceMobile's position as a leading player in the emerging space-based cellular broadband market.
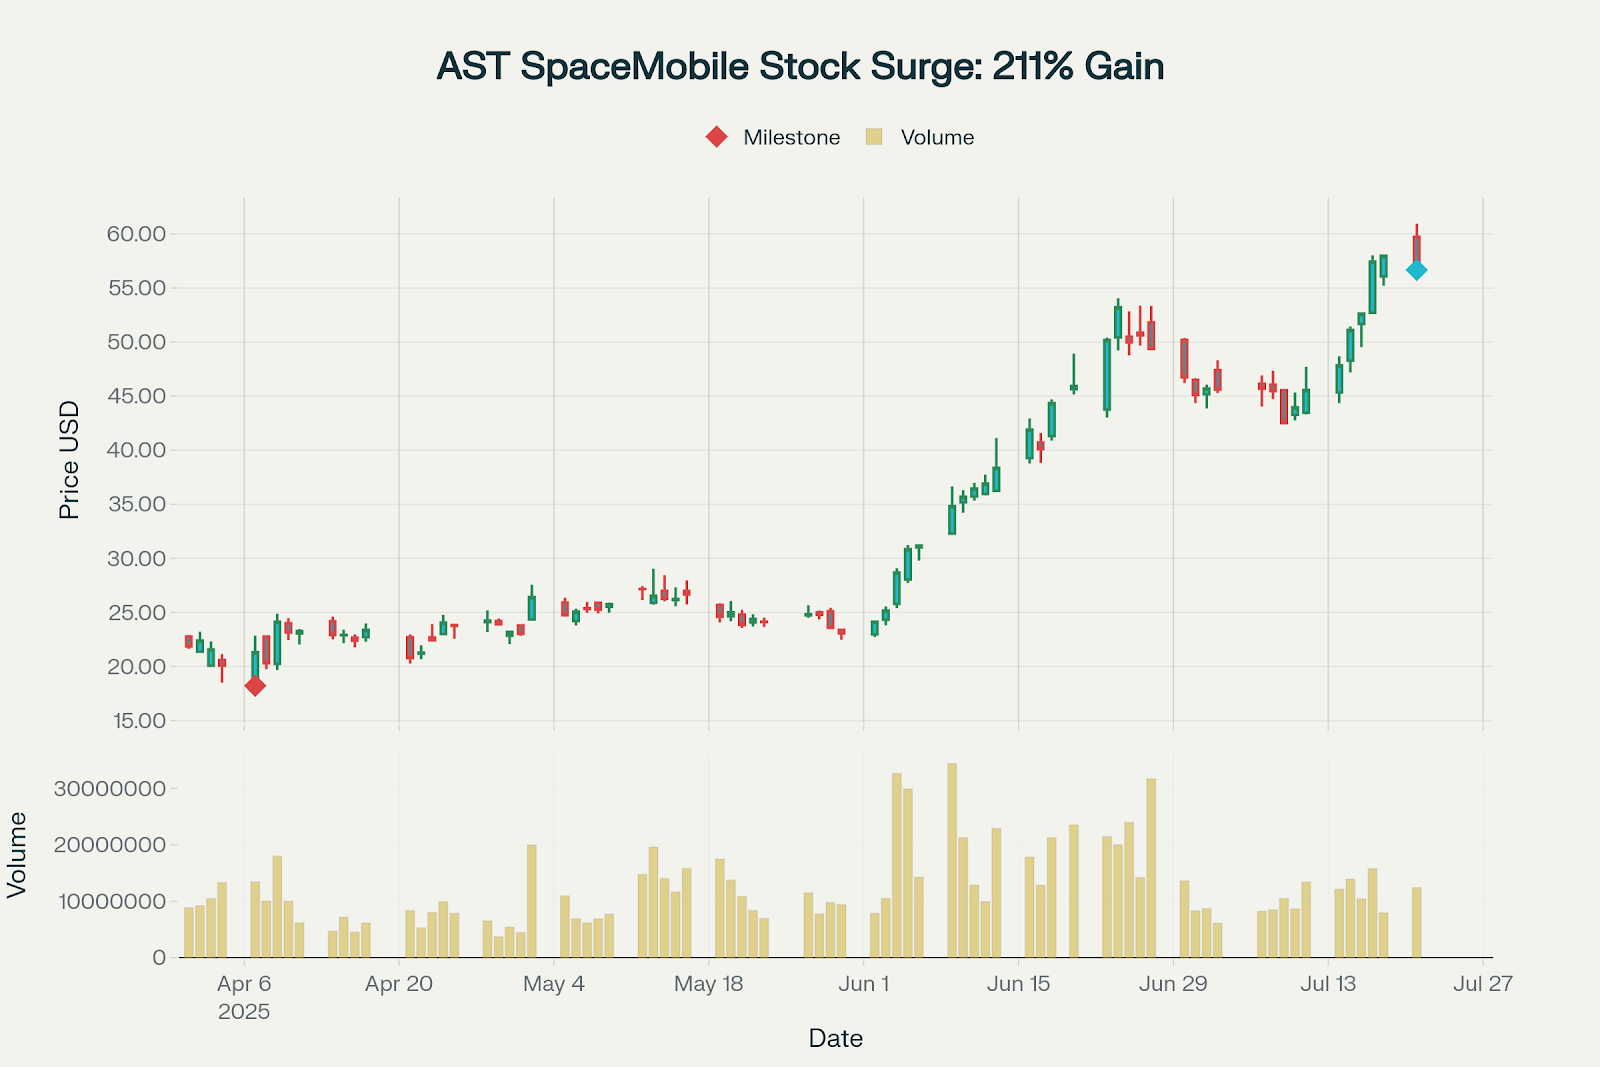
AST SpaceMobile Stock Performance: Dramatic 211% surge from April 7 to July 21, 2025
Understanding AST SpaceMobile: Revolutionary Space-Based Cellular Technology
AST SpaceMobile is building the first and only space-based cellular broadband network designed to operate directly with standard, unmodified mobile devices. Founded in 2017 by telecom entrepreneur Abel Avellan, the company aims to eliminate connectivity gaps by launching a constellation of Low Earth Orbit (LEO) satellites that function as "cell towers in space".
Unlike traditional satellite internet providers such as Starlink that require specialized equipment, AST SpaceMobile's revolutionary technology enables direct connectivity to everyday smartphones without any hardware modifications or special apps. This breakthrough approach targets the estimated 5.6 billion mobile users globally, particularly those in underserved regions where traditional cellular infrastructure is economically unfeasible.
The company's BlueBird satellites feature massive phased-array antennas spanning up to 2,400 square feet, making them among the largest commercial communications arrays ever deployed in low Earth orbit. These satellites are designed to deliver 4G and 5G broadband speeds of up to 120 Mbps directly to standard smartphones.
The Catalysts Behind ASTS's 211% Surge: A Month-by-Month Analysis
April 2025: Setting the Foundation ($18.22 - $23.21)
April 2025 marked the beginning of what would become AST SpaceMobile's most significant rally. The month saw relatively modest gains of 1.9%, but this period established the foundation for the explosive growth that followed. The company's stock found its lowest point on April 7 at $18.22, creating the baseline for the extraordinary journey ahead.
May 2025: Building Momentum ($23.07 - $29.05)
May experienced a slight decline of 3.1% as the market consolidated, but significant developments were occurring behind the scenes. The company continued advancing its satellite manufacturing capabilities and regulatory approvals, setting the stage for the transformational announcements that would drive the June surge.
June 2025: The Explosion Begins ($22.98 - $46.73)
June 2025 proved to be the pivotal month, delivering an astounding 103.4% gain as multiple catalysts converged:
The L-Band Spectrum Breakthrough
On June 13, AST SpaceMobile announced a $550 million settlement term sheet securing long-term access to 45 MHz of premium lower mid-band spectrum in the United States and Canada for over 80 years. This landmark deal with Ligado Networks, Viasat, and Inmarsat provided AST with 40 MHz of L-Band Mobile Satellite Service spectrum plus an additional 5 MHz in the 1670-1675 MHz band.
The spectrum acquisition was transformational because it enabled AST to operate independently without relying solely on carrier partners' spectrum, while supporting peak data transmission speeds of up to 120 Mbps to everyday smartphones. This represented a significant competitive moat in the satellite communications industry.
Strategic Partnership with Vodafone India
On June 18, AST SpaceMobile expanded its partnership with Vodafone Idea (Vi) to bring satellite-based cellular broadband services to India's underserved markets. This collaboration targets India's 1.1 billion mobile subscribers, with AST responsible for developing and managing the satellite constellation while Vi handles terrestrial network integration and market access.
The partnership aligns with India's Digital India initiative and positions AST to serve one of the world's largest telecom markets, where satellite communication will complement terrestrial connectivity in challenging terrains.
July 2025: Sustained Growth and New Highs ($46.50 - $56.67)
July continued the upward trajectory with a 21.9% gain, driven by additional positive developments:
Google's Strategic Investment
In mid-July, Google (Alphabet) invested an additional $203.3 million through a private placement of 8.9 million shares at $22.84 each. This investment, part of Google's continued support following its January 2024 participation in AST's funding round, demonstrates big tech's confidence in the space-based cellular broadband market.
Enhanced Financial Position
AST SpaceMobile also secured a $100 million non-dilutive equipment financing facility led by Trinity Capital. This financing provides long-term liquidity through 2031 and marks the company's transition from research and development to full-scale manufacturing and network deployment.
Financial Performance and Market Metrics
Q1 2025 Financial Results
AST SpaceMobile's Q1 2025 financial performance reflected its pre-commercial status while demonstrating progress toward monetization:
Metric
Q1 2025
Q1 2024
Change
Revenue
$718,000
$500,000
+43.6%
Net Loss
$45.7 million
$19.7 million
-132%
Operating Expenses
$63.7 million
$56 million
+13.8%
Cash Position
$874.5 million
$565 million
+54.7%
The company's $874.5 million cash position provides substantial runway for its ambitious satellite deployment plans, while the increased operating expenses reflect the scaling of manufacturing and development activities.
Revenue Projections and Commercial Timeline
AST SpaceMobile has provided clear guidance for its transition to commercial operations:
- H2 2025 Revenue Target: $50-75 million from gateway equipment sales and early commercial services
- Government Contracts: $43 million Space Development Agency contract plus $20 million Defense Innovation Unit agreement
- Gateway Equipment Bookings: $13.6 million in Q1 2025, with approximately $10 million expected per quarter throughout 2025
Operational Milestones and Technical Achievements
Satellite Manufacturing and Launch Schedule
AST SpaceMobile has achieved significant operational milestones that support its commercial timeline:
Current Satellite Fleet
- 5 BlueBird Block 1 satellites currently operational in orbit
- 1 BlueWalker 3 test satellite providing proof-of-concept validation
Aggressive Launch Schedule
- First Block 2 BlueBird satellite launched in July 2025
- Five scheduled orbital launches over six to nine months
- Launch cadence: One to two launches monthly during 2025 and 2026
- Manufacturing capacity: Six satellites per month by Q3 2025
Technical Breakthroughs
AST has successfully demonstrated two-way video broadband calls with major carriers including AT&T, Verizon, Vodafone, and Rakuten Mobile using unmodified smartphones. These achievements validate the commercial viability of the technology and represent a significant milestone toward full service deployment.
Strategic Partnerships and Market Positioning
AST SpaceMobile has assembled an impressive portfolio of strategic partnerships:
Mobile Network Operator Relationships
- AT&T and Verizon: Providing 850 MHz low-band spectrum access in the United States
- Vodafone Group: European expansion through jointly-owned satellite service business
- Rakuten Mobile: Partnership for Japan market coverage
- 50+ MNO partnerships globally representing nearly 3 billion subscribers
Government and Defense Contracts
- $43 million U.S. Space Development Agency contract for Block 2 BlueBird satellites
- $20 million Defense Innovation Unit agreement for prototype demonstrations
- Direct prime contractor status enabling competition for additional government projects
Competitive Landscape and Market Dynamics
AST SpaceMobile's Competitive Advantages
Direct-to-Device Technology
AST's primary competitive moat lies in its ability to deliver broadband connectivity directly to unmodified smartphones. This eliminates the user friction associated with specialized equipment required by competitors like Starlink, creating a seamless experience for billions of existing mobile device users.
Spectrum Assets
The recent 45 MHz mid-band spectrum acquisition provides AST with a substantial competitive advantage. This spectrum, combined with carrier partnerships for low-band access, enables the company to deliver 120 Mbps speeds while maintaining excellent coverage characteristics.
Patent Portfolio
AST maintains over 2,600 patent and patent-pending claims globally, providing significant intellectual property protection for its direct-to-device satellite ecosystem.
Competitive Challenges
SpaceX Starlink Direct-to-Cell
SpaceX has launched approximately 350 direct-to-cellular satellites and has begun beta testing with T-Mobile. However, Starlink's current service is limited to text messaging, with voice and data capabilities planned for future deployment. AST's advantage lies in its ability to deliver full broadband services from launch.
Market Timing Pressures
The race for direct-to-device supremacy is intensifying, with competitors like Lynk Global and Globalstar also advancing their technologies. AST's early commercial deployment and spectrum advantages position it favorably, but execution remains critical.
Investment Risks and Challenges
Operational Risks
Manufacturing and Launch Execution
AST faces significant execution risks related to its ambitious satellite manufacturing and launch schedule. The company must successfully deploy 60+ satellites by 2026 to achieve continuous coverage goals. Launch delays or satellite failures could materially impact commercial timelines.
Capital Requirements
The company estimates $19-21 million average capital costs per Block 2 satellite for a 90-satellite constellation. This represents substantial ongoing capital requirements that may necessitate additional fundraising.
Financial and Market Risks
Valuation Concerns
With a current market capitalization exceeding $19 billion and minimal revenue, AST trades at extremely high valuation multiples. The stock's success depends heavily on successful execution of commercial deployment plans.
Competition and Market Saturation
Intensifying competition from well-funded rivals, particularly SpaceX's Starlink, poses ongoing competitive pressure. AST must maintain its technological and market advantages while scaling operations rapidly.
Future Outlook and Growth Prospects
Near-Term Catalysts (2025-2026)
Commercial Service Launch
AST expects to begin commercial beta services by end of 2025 with full commercial operations in early 2026. Success in these initial deployments will be critical for validating the business model and attracting additional customers.
Continuous Coverage Achievement
The company targets continuous cellular broadband coverage in key markets including the United States, Europe, and Japan by 2026. Achieving this milestone would represent a significant competitive advantage over rivals still in development phases.
Long-Term Growth Potential
Market Size and Opportunity
The global satellite internet market is projected to reach $30+ billion by 2030 with a compound annual growth rate of 30%. AST's direct-to-device model addresses a massive addressable market of 5.6 billion mobile subscribers.
Analyst Projections
Wall Street analysts project substantial revenue growth, with Bank of America forecasting $586.51 million in sales revenue by 2027. The consensus among analysts suggests breakeven by 2027 with profitable operations thereafter.
Tickeron: AI Trading Tools for a New Era of Space and Tech Innovation
As companies like AST SpaceMobile redefine global connectivity through groundbreaking space-based infrastructure, Tickeron helps traders identify and capitalize on similar high-impact market moves. Powered by machine learning, Tickeron delivers real-time analytics, trade ideas, and short-term forecasts across equities, ETFs, crypto, and more—enabling fast, informed decisions in fast-evolving sectors like aerospace and telecommunications.
Whether you're trading satellite tech, speculative growth, or market-moving news, Tickeron provides actionable insights powered by data, not hype.
Key features include:
- AI Trading Bots (60min / 15min / 5min): Machine learning agents that generate intraday trade ideas with precise entry and exit points based on current price action
- AI Pattern Search Engine that detects breakout chart setups with target levels and confidence ratings
- Trend Prediction Engine forecasting price direction and trade timing shortly after market open
- Real-Time Signal Screener offering dynamic buy/sell signals across thousands of stocks, ETFs, and crypto assets
In a market where innovation can launch stocks into orbit—like AST SpaceMobile’s 211% surge—Tickeron equips traders with the speed and clarity needed to stay ahead of the next big move.
Investment Conclusion
AST SpaceMobile's extraordinary 211% stock surge from April to July 2025 reflects the market's recognition of the company's transformational potential in satellite-based cellular communications. The convergence of multiple catalysts—including the $550 million spectrum deal, strategic partnerships with major telecom operators, Google's continued investment, and accelerating satellite deployment schedule—has positioned AST at the forefront of the space-based connectivity revolution.
However, investors must carefully weigh the substantial growth potential against significant execution risks. The company's success depends on flawless execution of its ambitious satellite deployment plans, successful commercial service launches, and maintaining competitive advantages in an increasingly crowded market.
For growth-oriented investors with high risk tolerance, AST SpaceMobile represents a compelling opportunity to participate in what could become a fundamental transformation of global telecommunications infrastructure. The company's unique direct-to-device technology, strategic partnerships, and substantial spectrum assets provide meaningful competitive advantages, while its strong financial position enables execution of near-term commercial goals.
As AST SpaceMobile transitions from development to commercial operations, 2025 and 2026 will be defining years that determine whether the company can fulfill its ambitious vision of connecting the unconnected billions worldwide. The remarkable stock performance from April to July 2025 suggests the market believes AST is well-positioned to capitalize on this unprecedented opportunity.
The analysis presented in this article is based on publicly available information and should not be considered personalized investment advice. Investors should conduct their own research and consider their risk tolerance before making investment decisions.
ASTS in upward trend: price rose above 50-day moving average on September 22, 2025
ASTS moved above its 50-day moving average on September 22, 2025 date and that indicates a change from a downward trend to an upward trend. In of 39 similar past instances, the stock price increased further within the following month. The odds of a continued upward trend are .

Technical Analysis (Indicators)
Bullish Trend Analysis
The Momentum Indicator moved above the 0 level on September 19, 2025. You may want to consider a long position or call options on ASTS as a result. In of 80 past instances where the momentum indicator moved above 0, the stock continued to climb. The odds of a continued upward trend are .
The Moving Average Convergence Divergence (MACD) for ASTS just turned positive on September 19, 2025. Looking at past instances where ASTS's MACD turned positive, the stock continued to rise in of 46 cases over the following month. The odds of a continued upward trend are .
The 10-day moving average for ASTS crossed bullishly above the 50-day moving average on September 30, 2025. This indicates that the trend has shifted higher and could be considered a buy signal. In of 11 past instances when the 10-day crossed above the 50-day, the stock continued to move higher over the following month. The odds of a continued upward trend are .
Following a +2 3-day Advance, the price is estimated to grow further. Considering data from situations where ASTS advanced for three days, in of 244 cases, the price rose further within the following month. The odds of a continued upward trend are .
Bearish Trend Analysis
The 10-day RSI Indicator for ASTS moved out of overbought territory on September 25, 2025. This could be a bearish sign for the stock. Traders may want to consider selling the stock or buying put options. Tickeron's A.I.dvisor looked at 37 similar instances where the indicator moved out of overbought territory. In of the 37 cases, the stock moved lower in the following days. This puts the odds of a move lower at .
The Stochastic Oscillator may be shifting from an upward trend to a downward trend. In of 59 cases where ASTS's Stochastic Oscillator exited the overbought zone, the price fell further within the following month. The odds of a continued downward trend are .
Following a 3-day decline, the stock is projected to fall further. Considering past instances where ASTS declined for three days, the price rose further in of 62 cases within the following month. The odds of a continued downward trend are .
ASTS broke above its upper Bollinger Band on September 22, 2025. This could be a sign that the stock is set to drop as the stock moves back below the upper band and toward the middle band. You may want to consider selling the stock or exploring put options.
The Aroon Indicator for ASTS entered a downward trend on September 17, 2025. This could indicate a strong downward move is ahead for the stock. Traders may want to consider selling the stock or buying put options.
The Tickeron PE Growth Rating for this company is (best 1 - 100 worst), pointing to outstanding earnings growth. The PE Growth rating is based on a comparative analysis of stock PE ratio increase over the last 12 months compared against S&P 500 index constituents.
The Tickeron Profit vs. Risk Rating rating for this company is (best 1 - 100 worst), indicating low risk on high returns. The average Profit vs. Risk Rating rating for the industry is 79, placing this stock better than average.
The Tickeron Seasonality Score of (best 1 - 100 worst) indicates that the company is fair valued in the industry. The Tickeron Seasonality score describes the variance of predictable price changes around the same period every calendar year. These changes can be tied to a specific month, quarter, holiday or vacation period, as well as a meteorological or growing season.
The Tickeron Price Growth Rating for this company is (best 1 - 100 worst), indicating steady price growth. ASTS’s price grows at a higher rate over the last 12 months as compared to S&P 500 index constituents.
The Tickeron SMR rating for this company is (best 1 - 100 worst), indicating weak sales and an unprofitable business model. SMR (Sales, Margin, Return on Equity) rating is based on comparative analysis of weighted Sales, Income Margin and Return on Equity values compared against S&P 500 index constituents. The weighted SMR value is a proprietary formula developed by Tickeron and represents an overall profitability measure for a stock.
The Tickeron Valuation Rating of (best 1 - 100 worst) indicates that the company is significantly overvalued in the industry. This rating compares market capitalization estimated by our proprietary formula with the current market capitalization. This rating is based on the following metrics, as compared to industry averages: P/B Ratio (15.385) is normal, around the industry mean (5.534). P/E Ratio (0.000) is within average values for comparable stocks, (106.723). ASTS's Projected Growth (PEG Ratio) (0.000) is slightly lower than the industry average of (1.418). Dividend Yield (0.000) settles around the average of (0.032) among similar stocks. ASTS's P/S Ratio (2000.000) is very high in comparison to the industry average of (41.935).
Notable companies
Industry description
Market Cap
High and low price notable news
Volume
Fundamental Analysis Ratings
The average fundamental analysis ratings, where 1 is best and 100 is worst, are as follows


Advertisement
General Information
a blank check company, which has formed for the purpose of effecting a merger, capital stock exchange, asset acquisition, stock purchase, and reorganization
Industry TelecommunicationsEquipment
Advertisement