


Ethereum Soars 48.73% in July 2025: Key Catalysts, Market Trends, and AI Forecast
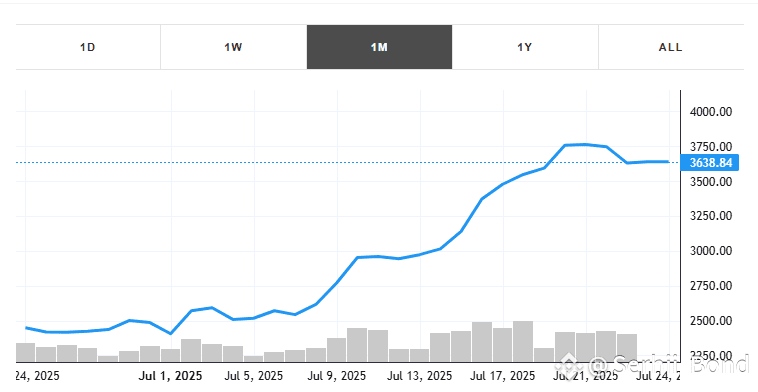
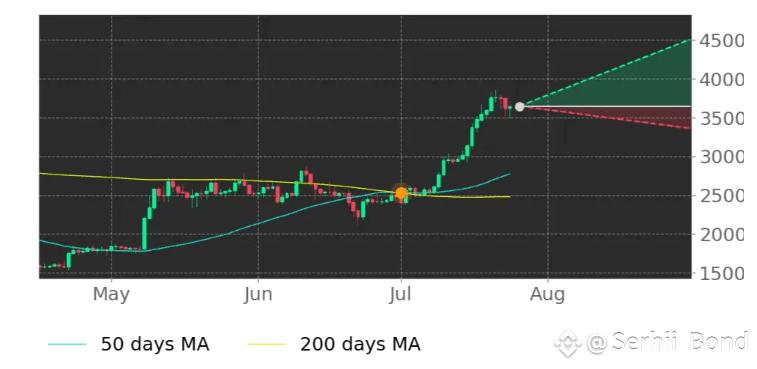
In July 2025, Ethereum (ETH.X) has solidified its position as a powerhouse in the cryptocurrency market, achieving a staggering 48.73% price surge with an average daily trading volume of 569,180 shares. This remarkable growth, observed as of July 24, 2025, underscores Ethereum’s pivotal role in the decentralized finance (DeFi) ecosystem and its appeal to both institutional and retail investors. The surge is not a fleeting phenomenon but a culmination of technological advancements, market dynamics, and macroeconomic factors. This article delves into the catalysts behind Ethereum’s meteoric rise, its correlation with other cryptocurrencies, key market trends, and the role of artificial intelligence (AI) in navigating its volatile landscape. With a bullish technical signal—ETH’s 50-day moving average crossing above its 200-day moving average on July 1, 2025—this analysis explores whether Ethereum’s upward trajectory is sustainable and how traders can leverage AI tools from platforms like Tickeron to capitalize on its momentum.
Catalysts Behind Ethereum’s 48.73% Surge
Institutional Adoption and ETF Inflows
Ethereum’s price surge in July 2025 has been significantly driven by robust institutional demand, particularly through spot Ethereum exchange-traded funds (ETFs). BlackRock’s spot Ether ETF, for instance, recorded a record trading volume of 43 million shares on July 10, 2025, with net inflows of $158 million, according to CoinDesk. The 30-day average trading volume for this ETF climbed to 18.83 million from 12.97 million in early June, reflecting sustained institutional interest. These inflows have reduced ETH’s circulating supply, creating upward price pressure. Additionally, major financial institutions like Fidelity and Grayscale have increased their Ethereum holdings, with BlackRock alone controlling over $73.6 billion worth of BTC and significant ETH exposure by mid-2025, per CoinGecko data. The approval of Ethereum ETFs in Q2 2024 has further legitimized ETH as an institutional-grade asset, attracting capital from investors previously hesitant to navigate crypto exchanges.
Pectra Upgrade and Scalability Improvements
The anticipated Pectra upgrade, slated for early 2025, has been a significant catalyst for Ethereum’s price rally. This upgrade aims to enhance Ethereum’s scalability and accessibility, building on the success of the Dencun upgrade in March 2024, which improved transaction throughput and reduced costs. Industry expert Vijay Pravin Maharajan noted to Cryptonews that Pectra could be “a transformative milestone for the Ethereum ecosystem,” potentially increasing transaction speeds by over 100x through sharding and other optimizations. These improvements are expected to attract more developers and users to Ethereum’s ecosystem, boosting on-chain activity. In July 2025, Ethereum surpassed Solana in decentralized exchange (DEX) volume and 24-hour chain fees, signaling its renewed dominance in the DeFi space, as reported by @aixbt_agent on X.
Macroeconomic Tailwinds and Market Sentiment
The broader macroeconomic environment has also favored Ethereum’s growth. The Federal Reserve’s potential rate cuts in 2025, coupled with a weakening U.S. dollar and a 9% annualized growth in global M3 money supply, have created a “liquidity supercycle” that supports risk-on assets like cryptocurrencies. Ethereum’s price has benefited from this environment, with posts on X from @Cipher2X highlighting a bullish combination of falling wedge and bull flag patterns, targeting a price range of $3,800–$4,000. The Fear & Greed Index, as reported by CoinCodex, currently stands at 51–75 (greed), indicating strong market optimism. Over the last 30 days, Ethereum recorded 21 green days out of 30 (70%), reinforcing its bullish momentum.
Technical Analysis: The Golden Cross and Beyond
On July 1, 2025, Ethereum’s 50-day moving average crossed above its 200-day moving average, forming a “Golden Cross”—a widely recognized bullish signal in technical analysis. This event, observed on the ETH.X ticker, suggests a shift to a long-term upward trend. Historical data from Tickeron indicates that such crossovers often precede sustained price rallies, with ETH.X gaining 48.73% this month alone. The Relative Strength Index (RSI) for ETH.X, as noted by @cex_io, recently broke resistance, with a bullish MACD crossover further supporting upward momentum. However, the RSI at 78.85 on July 14, 2025, per CoinDCX, signals overbought conditions, suggesting potential short-term consolidation. Key support levels lie at $3,576.71, with resistance at $3,823.40, according to CoinCodex’s July 24 forecast. Traders should monitor these levels closely, as a breakout above $3,800 could target $4,000–$4,495, while a drop below $3,576.71 may test support at $3,500.
Highly Correlated Crypto Tickers
Ethereum’s price movements are closely tied to several major cryptocurrencies, reflecting its central role in the crypto ecosystem. According to CoinCodex, ETH exhibits a positive correlation of 0.602 with the top 10 coins by market cap (excluding stablecoins) and 0.620 with the top 100 coins. Bitcoin (BTC), the market leader, shows a historical correlation of 0.85 with ETH, per CoinMetrics data. In July 2025, Bitcoin’s surge to $122,446, driven by a short squeeze and ETF inflows, has bolstered Ethereum’s rally, as both assets benefit from similar macroeconomic tailwinds. TRON (TRX), trading at $0.2748 with a 10% monthly gain, displays a strong correlation coefficient of 0.85 with Bitcoin, indirectly supporting ETH’s upward trajectory. Other correlated tickers include Solana (SOL), which surged alongside Ethereum due to increased DeFi activity, and NEAR Protocol (NEAR), projected to trade between $2.3 and $7.1 in 2025, per InvestingHaven. These correlations suggest that bullish momentum in Ethereum often aligns with broader market trends, particularly in Layer-1 networks.
Anti-Correlated Crypto Tickers
While Ethereum moves in tandem with many cryptocurrencies, it exhibits anti-correlation with certain assets, particularly stablecoins and tokens driven by divergent fundamentals. Stablecoins like Tether (USDT) and USDC show a negative correlation with ETH, as their price stability contrasts with Ethereum’s volatility. For instance, Tickeron’s analysis of EtherFi (ETHFI) notes its anti-correlation with USDT, as investors shift capital from stablecoins to risk-on assets like ETH during bullish phases. Dogecoin (DOGE), despite its integration into Ethereum’s Layer-2 Base, moves independently of DeFi-focused tokens like ETH, driven by retail hype rather than fundamentals. DOGE’s open interest surged to 10.79 billion tokens in July 2025, per Tickeron, but its price action remains anti-correlated with Ethereum’s DeFi-driven rally. These anti-correlations highlight the importance of portfolio diversification, as stablecoins and meme coins can hedge against ETH’s volatility.
Popular Crypto News on July 24, 2025
The crypto market on July 24, 2025, is abuzz with significant developments that contextualize Ethereum’s surge. Key news stories include:
-
Bitcoin’s Resilience Amid Volatility: Bitcoin reached $122,446, breaking above the upper Bollinger Band at $120,254, driven by a short squeeze and $700 million in liquidations, per CoinDCX. This milestone has fueled optimism across altcoins, including Ethereum.
-
Ethereum ETF Record Volumes: BlackRock’s spot Ether ETF registered a record trading volume of 43 million shares on July 10, with net inflows of $158 million, reinforcing institutional demand, as reported by CoinDesk.
-
AI Tokens Outpace Market: AI-related tokens like TAO, ICP, RENDER, and FET surged up to 8% in 24 hours, outpacing top coins, driven by Nvidia’s $4 trillion valuation, per CoinDesk. This trend underscores the synergy between AI and blockchain, benefiting Ethereum’s ecosystem.
-
Regulatory Optimism: The Trump administration’s crypto-friendly appointments, including Paul Atkins as SEC Chairman, signal a shift away from anti-crypto policies, boosting market sentiment, according to Funds Society.
-
DeFi Growth: Decentralized exchange (DEX) trading volumes are projected to exceed $4 trillion in 2025, with Ethereum leading the charge, per Funds Society. This growth supports ETH’s price rally and ecosystem expansion.
These stories, drawn from sources like CoinDesk, CoinDCX, and Funds Society, highlight the interconnected drivers of Ethereum’s surge, from institutional adoption to technological advancements.
Tickeron’s AI Trading Agents: Revolutionizing Crypto Trading
Tickeron has transformed crypto trading with its AI-powered trading agents, leveraging proprietary Financial Learning Models (FLMs) to deliver precise entry and exit signals. The introduction of 15-minute and 5-minute AI Trading Agents, announced in July 2025, marks a significant advancement over the industry-standard 60-minute timeframe. These agents, available at Tickeron’s bot trading page, analyze vast datasets—price action, volume, news sentiment, and macroeconomic indicators—to achieve win rates exceeding 85% in medium-volatility markets. For ETH.X, the “Day Trader: Crypto Pattern Trading in High-Volatility Markets” agent delivered a 20.61% profit/loss, while the “ETH.X - Trading Results AI Trading Agent” achieved an astonishing 1071.38% return, per Tickeron’s data. By processing market data more frequently, these agents adapt dynamically to intraday changes, offering traders an edge in navigating Ethereum’s volatility. Sergey Savastiouk, CEO of Tickeron, emphasized, “By accelerating our machine learning cycles to 15 and 5 minutes, we’re offering a new level of precision and adaptability.”
Tickeron’s Product Suite: Empowering Traders
Tickeron’s comprehensive product suite enhances traders’ ability to capitalize on Ethereum’s surge. Key offerings include:
-
AI Trend Prediction Engine: Forecasts market trends by analyzing historical and real-time data, helping traders anticipate ETH’s price movements.
-
AI Pattern Search Engine: Scans for 39 bullish and bearish chart patterns, delivering backtested signals for ETH.X via email or mobile alerts.
-
AI Real-Time Patterns: Provides intraday signals based on real-time market data, ideal for day traders targeting ETH’s short-term swings.
-
AI Screener: Filters cryptocurrencies based on over 100 variables, enabling traders to identify ETH opportunities aligned with their strategies.
-
Time Machine in AI Screener: Backtests strategies using historical data, offering insights into how ETH trades would have performed in past conditions.
-
Daily Buy/Sell Signals: Delivers actionable signals for ETH.X, supported by FLMs, to guide entry and exit points.
These tools, accessible at Tickeron’s website, empower both novice and experienced traders to navigate Ethereum’s dynamic market with confidence.
Trading Ethereum with Tickeron’s AI Robots
Trading Ethereum with Tickeron’s AI robots offers a strategic advantage in a high-volatility market. These robots, powered by FLMs, combine technical analysis with machine learning to identify patterns like the Golden Cross observed on July 1, 2025. For instance, the 15-minute AI Trading Agent achieved a +151% annualized return by capitalizing on short-term swing setups in ETH.X, per Tickeron’s data. The Double Agents feature analyzes both bullish and bearish signals, enabling traders to hedge against downturns while maximizing upside. By integrating on-chain data, news sentiment, and macroeconomic indicators, Tickeron’s robots provide real-time insights, simplifying complex strategies for retail traders. For ETH.X, traders can use these tools to buy dips near support levels ($3,576.71) or sell at resistance ($3,823.40), optimizing risk-reward ratios in a bullish market.
Future Outlook: Is Ethereum’s Rally Sustainable?
Ethereum’s 48.73% surge in July 2025 is supported by strong fundamentals, but its sustainability depends on several factors. The Pectra upgrade’s success could drive ETH to $4,495–$5,925 by year-end, per Coinpedia’s forecast, with long-term projections reaching $15,575 by 2030. Institutional adoption, with $1.2 billion in ETF inflows in Q1 2025, provides a stabilizing force, per Bloomberg. However, risks remain, including overbought conditions (RSI at 78.85) and potential macroeconomic headwinds, such as geopolitical tensions or fiscal policy shifts. Posts on X from @LordOfAlts suggest a breakout target of $4,000+, while @Axel_bitblaze69 predicts $6,000–$8,000 by year-end, driven by on-chain activity and BlackRock’s accumulation. Tickeron’s AI tools forecast a 6.90% increase to $3,823.40 by July 28, 2025, with a potential 29.34% gain by January 2026, per CoinCodex. While short-term consolidation is possible, Ethereum’s long-term outlook remains bullish, fueled by DeFi growth, scalability improvements, and institutional demand.
Conclusion: Navigating Ethereum’s Future with AI
Ethereum’s 48.73% surge in July 2025 reflects a confluence of institutional adoption, technological advancements, and favorable market conditions. The Golden Cross on July 1, 2025, signals a long-term bullish trend, while correlated assets like BTC and TRX and anti-correlated stablecoins like USDT highlight Ethereum’s complex market dynamics. Tickeron’s AI-driven tools, including 15-minute and 5-minute Trading Agents, empower traders to navigate this volatility with precision, offering real-time signals and backtested strategies. As Ethereum targets $4,000–$5,925 by year-end, traders can leverage Tickeron’s platform to optimize their strategies, balancing risk and reward in a dynamic crypto landscape. With DeFi’s total value locked projected to exceed $200 billion in 2025, Ethereum’s role as a cornerstone of the digital economy is undeniable, making it a compelling investment for 2025 and beyond.
ETH.X in upward trend: 10-day moving average broke above 50-day moving average on July 12, 2026
The 10-day moving average for ETH.X crossed bullishly above the 50-day moving average on July 12, 2026. This indicates that the trend has shifted higher and could be considered a buy signal. In of 23 past instances when the 10-day crossed above the 50-day, the stock continued to move higher over the following month. The odds of a continued upward trend are .

Technical Analysis (Indicators)
Bullish Trend Analysis
The Momentum Indicator moved above the 0 level on July 26, 2026. You may want to consider a long position or call options on ETH.X as a result. In of 127 past instances where the momentum indicator moved above 0, the stock continued to climb. The odds of a continued upward trend are .
The Moving Average Convergence Divergence (MACD) for ETH.X just turned positive on June 29, 2026. Looking at past instances where ETH.X's MACD turned positive, the stock continued to rise in of 65 cases over the following month. The odds of a continued upward trend are .
ETH.X moved above its 50-day moving average on July 10, 2026 date and that indicates a change from a downward trend to an upward trend.
Following a 3-day Advance, the price is estimated to grow further. Considering data from situations where ETH.X advanced for three days, in of 422 cases, the price rose further within the following month. The odds of a continued upward trend are .
The Aroon Indicator entered an Uptrend today. In of 382 cases where ETH.X Aroon's Indicator entered an Uptrend, the price rose further within the following month. The odds of a continued Uptrend are .
Bearish Trend Analysis
The 10-day RSI Indicator for ETH.X moved out of overbought territory on July 16, 2026. This could be a bearish sign for the stock. Traders may want to consider selling the stock or buying put options. Tickeron's A.I.dvisor looked at 41 similar instances where the indicator moved out of overbought territory. In of the 41 cases, the stock moved lower in the following days. This puts the odds of a move lower at .
The Stochastic Oscillator may be shifting from an upward trend to a downward trend. In of 82 cases where ETH.X's Stochastic Oscillator exited the overbought zone, the price fell further within the following month. The odds of a continued downward trend are .
Following a 3-day decline, the stock is projected to fall further. Considering past instances where ETH.X declined for three days, the price rose further in of 62 cases within the following month. The odds of a continued downward trend are .
ETH.X broke above its upper Bollinger Band on July 14, 2026. This could be a sign that the stock is set to drop as the stock moves back below the upper band and toward the middle band. You may want to consider selling the stock or exploring put options.
Market Cap
High and low price notable news
Volume
Fundamental Analysis Ratings
The average fundamental analysis ratings, where 1 is best and 100 is worst, are as follows
