Go to the list of all blogs
Serhii Bondarenko's Avatar
published in Blogs
Jun 30, 2025

June 30, 2025: The Top 10 Virtual Agents AI-Powered FLMs Use New 5-Minute Trading Agents to Reach Win Rates of 80%+

Introduction: The Rise of AI in Financial Markets

June 2025 has marked a turning point in AI-driven trading. Tickeron, a trailblazer in artificial intelligence for financial markets, has unveiled a series of upgraded Financial Learning Models (FLMs) that significantly accelerate learning cycles and market responsiveness. These improvements have enabled the launch of new AI-powered Virtual Agents operating on ultra-short 5-minute timeframes, demonstrating a remarkable win rate exceeding 80% across several trading strategies.

Backed by these advanced systems, Tickeron’s AI agents have delivered staggering annualized returns, validating the company's continued innovation in financial technology.

Next-Gen Financial Learning Models: Faster, Smarter, More Adaptive

The latest FLMs are engineered with enhanced processing capabilities that allow them to rapidly assimilate new market data and adjust trading behavior in real time. This responsiveness has been the foundation for deploying new AI agents operating on both 15-minute and 5-minute intervals. The 5-minute agents, in particular, have shown exceptional agility in recognizing micro-patterns and executing profitable trades with precision.

Tickeron's rapid evolution of FLMs also reflects its increased computational capacity and data throughput, allowing models to learn and adapt faster than ever before. As a result, these trading systems now exhibit shorter reaction times to market shifts—an essential capability in today's fast-moving financial environment.

5-Minute Virtual Agents: Revolutionizing Intraday Trading

Tickeron’s new breed of AI Virtual Agents functions on 5-minute timeframes, optimized for intraday traders seeking fast, data-driven decisions. These agents use proprietary FLMs and machine learning to:

  • Recognize bullish/bearish patterns in real-time
     
  • Filter out noise through trend validation mechanisms
     
  • Execute high-frequency trades with smart risk controls
     
  • Deliver swing trading strategies confirmed with daily chart exits
     

This hybrid approach—merging fast pattern recognition with higher-timeframe confirmations—has yielded high consistency and robust returns, as outlined in the performance reports below.

Top 10 Performing AI Agents – As of June 30, 2025

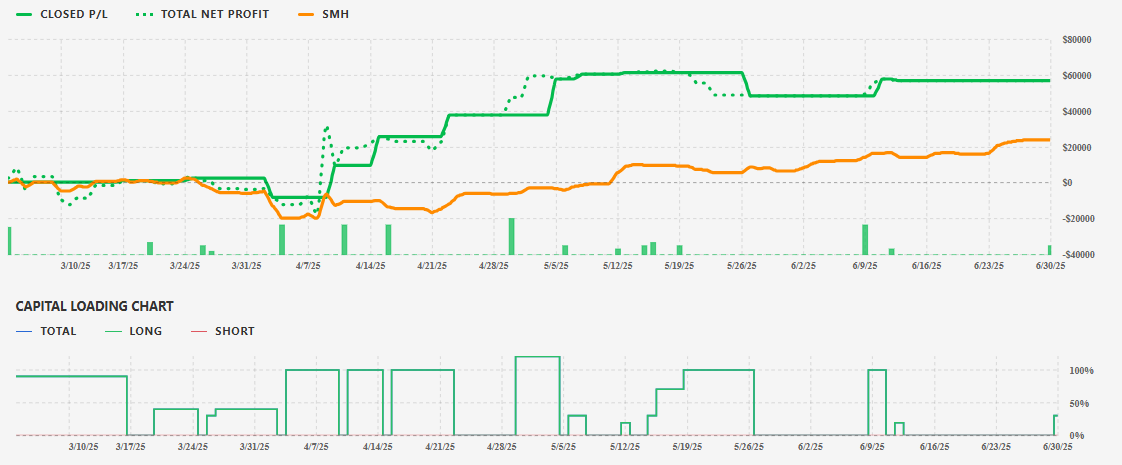
1. SOXL – AI Trading Agent (5-Minute)

  • Annualized Return: +296%


  • Overview: Exceptional performance driven by high volatility and precision timing in semiconductor bull ETF trades.
     

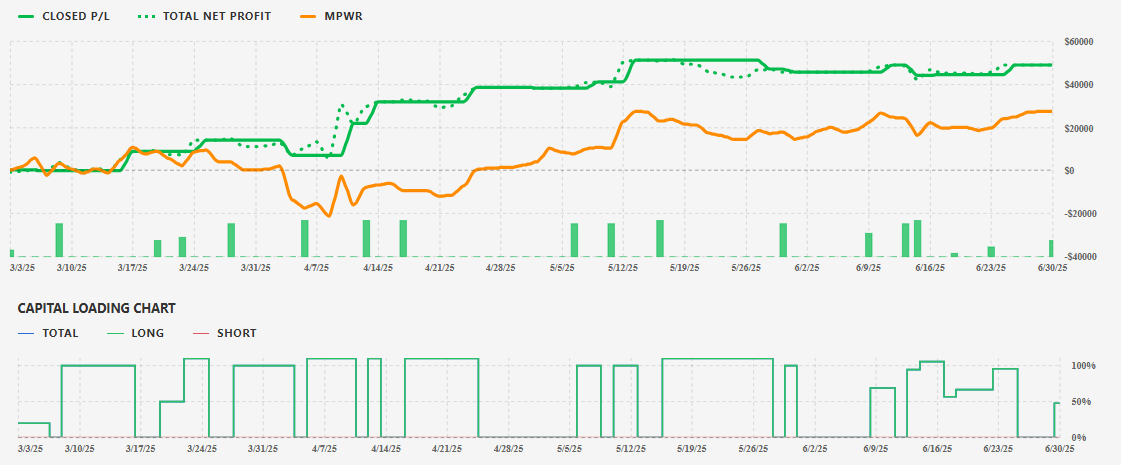
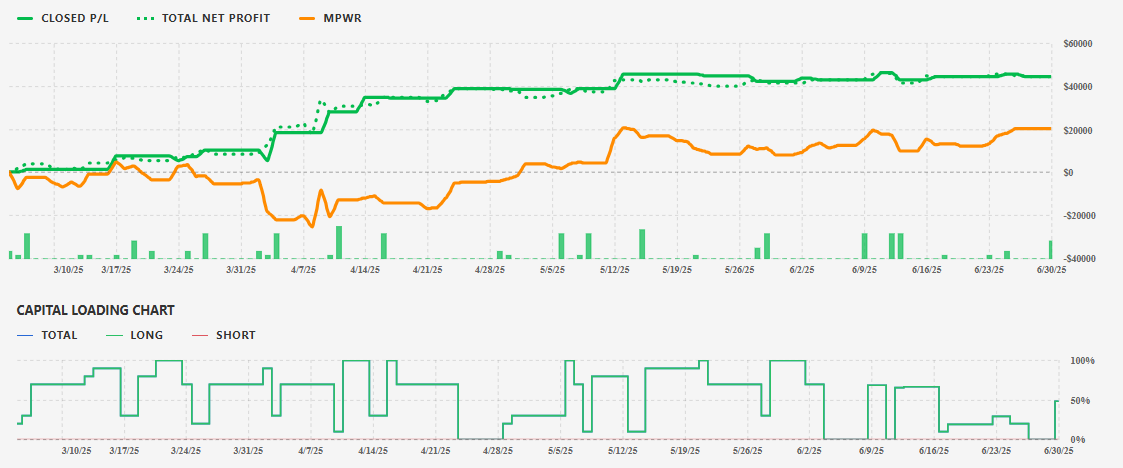
2. MPWR – AI Trading Agent (5-Minute)

  • Annualized Return: +236%


  • Overview: MPWR’s strong fundamentals, paired with AI’s tactical entries, resulted in sustained profitability.
     

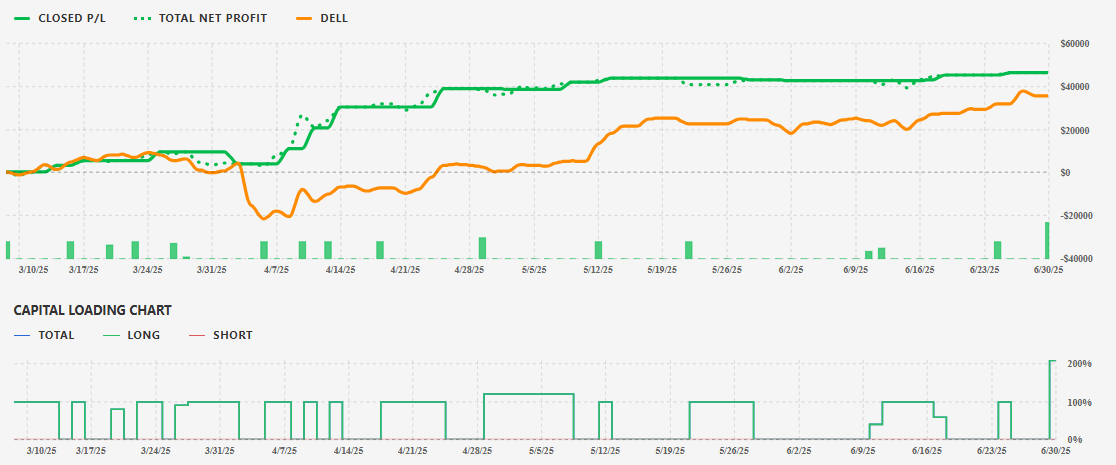
3. DELL – AI Trading Agent (5-Minute)

  • Annualized Return: +230%


  • Overview: The agent effectively capitalized on earnings-driven momentum and sector rotation patterns.
     

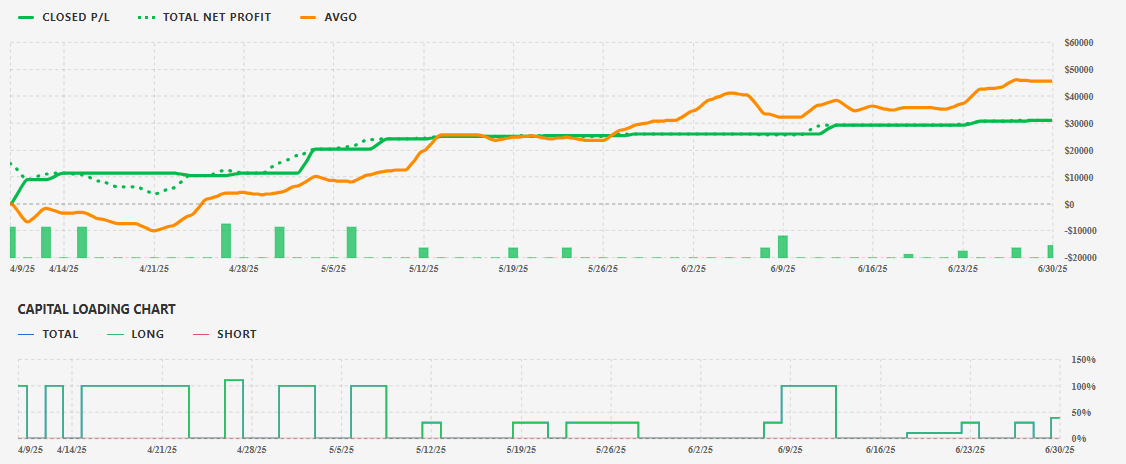
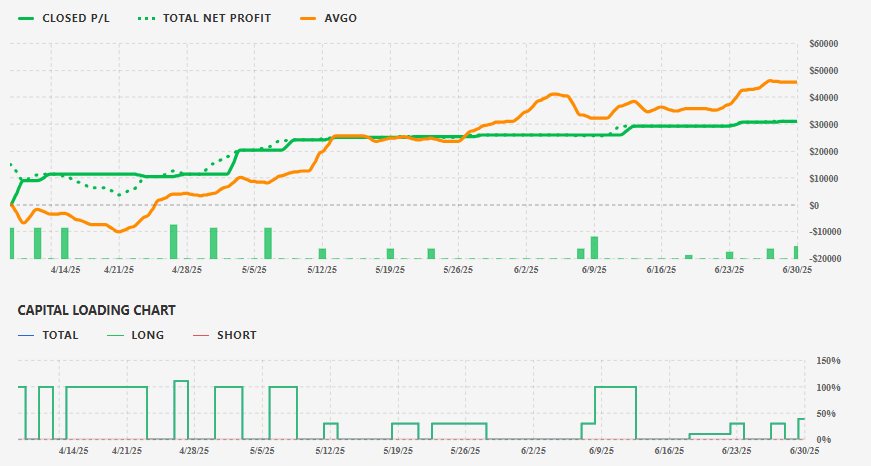
4. AVGO – AI Trading Agent (5-Minute)

  • Annualized Return: +222%


  • Overview: AVGO’s trend strength, combined with AI’s swing-exit logic, drove solid gains.
     

5. MPWR / SOXS – AI Double Agent (5-Minute)

  • Annualized Return: +212%


  • Overview: Balanced long/short exposure using inverse ETFs to hedge and profit in both directions.
     

6. AVGO / SOXS – AI Double Agent (5-Minute)

  • Annualized Return: +165%


  • Overview: Smart sector hedging with AVGO long positions and SOXS shorts to mitigate drawdowns.
     

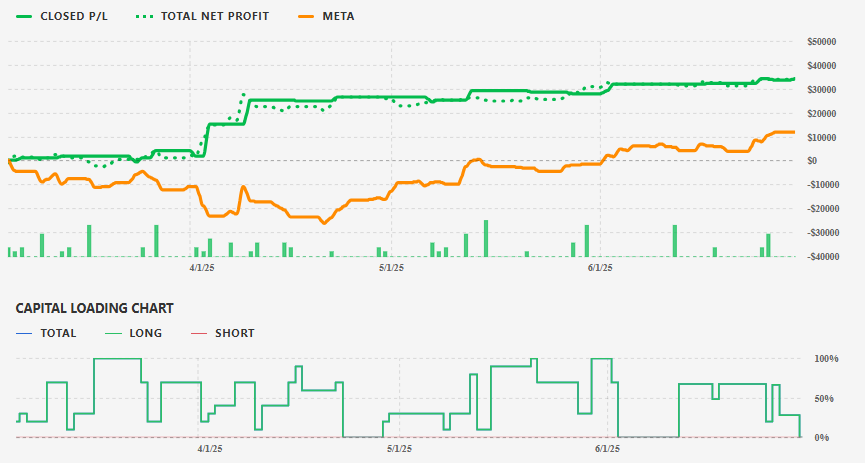
7. META / SOXS – AI Double Agent (5-Minute)

  • Annualized Return: +149%


  • Overview: Technology volatility is captured effectively through META/SOXS counter-trades.
     

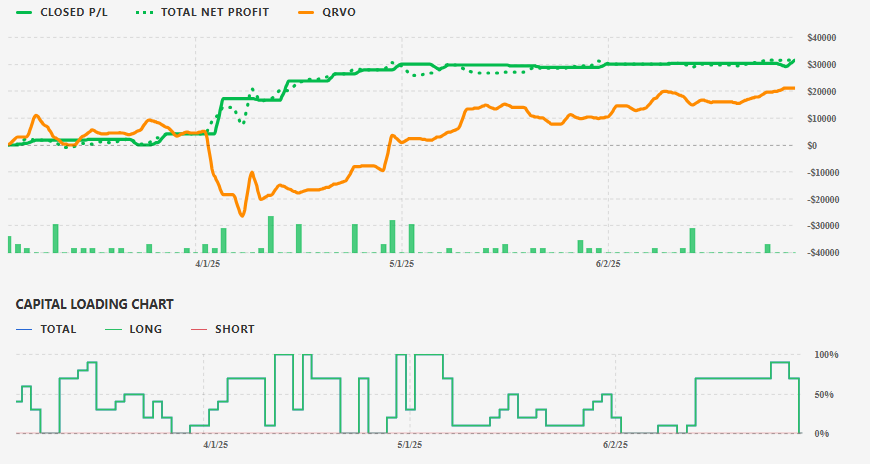
8. QRVO / SOXS – AI Double Agent (5-Minute)

  • Annualized Return: +130%


  • Overview: A niche performer combining mid-cap tech with inverse ETF protection.
     

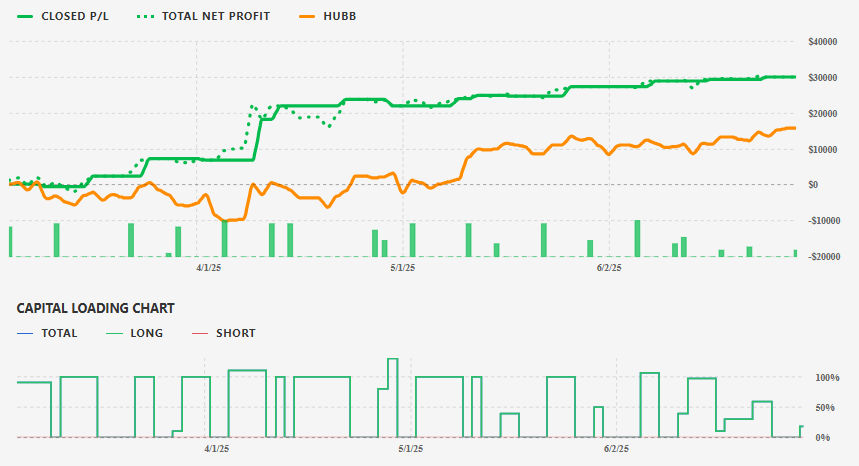
9. HUBB – AI Trading Agent (5-Minute)

  • Annualized Return: +124%


  • Overview: Focused trades on a utility stock with lower volatility, yet surprisingly strong results.
     

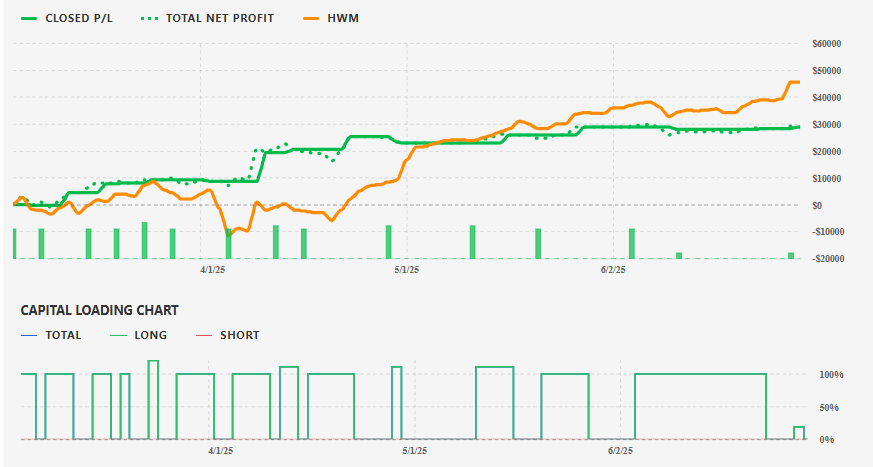
10. HWM – AI Trading Agent (5-Minute)

  • Annualized Return: +121%


  • Overview: Capitalizing on industrial sector movements with disciplined trade entry/exit.
     

Inverse ETFs: A Smart Hedge for Short-Term Traders

Inverse ETFs, such as SOXS, have played a pivotal role in the performance of several AI Double Agents. Designed to deliver opposite performance to a benchmark index, these funds allow traders to profit from market declines.

However, they require caution due to daily compounding and volatility decay. Tickeron’s AI agents, backed by FLMs, mitigate these risks by analyzing intraday trends and limiting exposure through position and risk controls.

Suitability and Accessibility

Tickeron’s AI robots are tailored for both novice and intermediate traders. Features such as:

  • Automated trade execution
     
  • Daily timeframe trend filters
     
  • Real-time alerts
     
  • Intuitive dashboards
     

...make it easier for users to gain confidence while the system handles the complex analytics and technical execution.

Technical Strategy: Blending Speed with Structure

The core strategy of the 5-minute AI agents includes the following features:

  • High-Frequency Pattern Recognition: Instant signal generation from 5-minute data.
     
  • FLM-Based Trend Filtering: Smarter entries through macro-level trend validation.
     
  • ML Optimization: Adaptive learning to fine-tune trading parameters.
     
  • Smart Swing Trading Logic: Entry on 5-minute, exits confirmed via daily charts.
     
  • Cap on Open Positions: Limits risk by holding a maximum of 10 concurrent trades.
     
  • Real-Time Monitoring: Continuous data analysis for smart trade management.
     

Market Fit: Ideal for Medium Volatility Conditions

Tickeron's internal performance diagnostics rate these AI agents as “Best in Class” under medium-volatility market conditions. This is due to their balanced approach between opportunity capture and drawdown control.

  • Volatility Profile: Medium
     
  • Profit/Dip Ratio: Medium
     
  • Diversification Score: Low (concentrated trades, focused risk)
     
  • User Skill Level: Beginner to Intermediate
     

Tickeron’s Vision and Continued Innovation

At the helm of this AI trading evolution is Sergey Savastiouk, CEO of Tickeron. Under his leadership, the company has built a comprehensive AI ecosystem that empowers individual traders with institutional-grade tools.

Tickeron’s innovation includes:

  • Beginner-friendly Bots: Designed for ease of use
     
  • High-liquidity Stock Robots: For accurate order execution
     
  • Double Agents: To trade both bullish and bearish signals concurrently
     
  • Real-Time AI Insights: To enhance clarity and transparency
     

These offerings are not only reshaping how retail investors engage with the markets but also setting a new benchmark for performance and usability in the world of AI-driven finance.

Conclusion: FLMs Signal a New Era of Trading

With upgraded Financial Learning Models and the successful deployment of 5-minute AI trading agents, Tickeron has once again demonstrated the power of AI to deliver measurable, real-world financial results.

An 80%+ win rate, combined with annualized returns nearing 300%, positions these systems at the forefront of intelligent trading. As AI continues to evolve, tools like Tickeron’s FLMs will likely become the standard for retail and institutional traders alike, bridging the gap between complexity and accessibility and ushering in a more data-driven era of finance.

Disclaimers and Limitations

Related Ticker: SOXL, DELL, MPWR, AVGO, SOXS

Contributor

Serhii Bondarenko is an AI-focused trading strategist and financial markets analyst specializing in the development and application of AI trading bots and autonomous trading agents. His work combines technical analysis, fundamental analysis, and quantitative research to identify market patterns, forecast price movements, and analyze liquidity, volatility, and correlations across global stock markets. Serhii actively publishes market insights, forecasts, and trading frameworks on platforms such as Investing.com and Finextra, with a strong focus on AI-driven decision-making and next-generation algorithmic trading. His research aims to bridge the gap between traditional trading methodologies and advanced artificial intelligence, helping traders and investors navigate complex and rapidly evolving market conditions.


Momentum Indicator for SOXL turns positive, indicating new upward trend

SOXL saw its Momentum Indicator move above the 0 level on September 17, 2026. This is an indication that the stock could be shifting in to a new upward move. Traders may want to consider buying the stock or buying call options. Tickeron's A.I.dvisor looked at 80 similar instances where the indicator turned positive. In 73 of the 80 cases, the stock moved higher in the following days. The odds of a move higher are at 90%.

Price Prediction Chart

Technical Analysis (Indicators)

Bullish Trend Analysis

The Moving Average Convergence Divergence (MACD) for SOXL just turned positive on September 04, 2026. Looking at past instances where SOXL's MACD turned positive, the stock continued to rise in 48 of 50 cases over the following month. The odds of a continued upward trend are 90%.

SOXL moved above its 50-day moving average on September 21, 2026 date and that indicates a change from a downward trend to an upward trend.

The 10-day moving average for SOXL crossed bullishly above the 50-day moving average on September 25, 2026. This indicates that the trend has shifted higher and could be considered a buy signal. In 14 of 14 past instances when the 10-day crossed above the 50-day, the stock continued to move higher over the following month. The odds of a continued upward trend are 90%.

Following a +10.72% 3-day Advance, the price is estimated to grow further. Considering data from situations where SOXL advanced for three days, in 316 of 339 cases, the price rose further within the following month. The odds of a continued upward trend are 90%.

The Aroon Indicator entered an Uptrend today. In 261 of 270 cases where SOXL Aroon's Indicator entered an Uptrend, the price rose further within the following month. The odds of a continued Uptrend are 90%.

Bearish Trend Analysis

The RSI Indicator demonstrated that the stock has entered the overbought zone. This may point to a price pull-back soon.

The Stochastic Oscillator demonstrated that the ticker has stayed in the overbought zone for 9 days. The longer the ticker stays in the overbought zone, the sooner a price pull-back is expected.

SOXL broke above its upper Bollinger Band on September 21, 2026. This could be a sign that the stock is set to drop as the stock moves back below the upper band and toward the middle band. You may want to consider selling the stock or exploring put options.

Notable companies

The most notable companies in this group are NVIDIA Corp (NASDAQ:NVDA), Taiwan Semiconductor Manufacturing Company Ltd (NYSE:TSM), Broadcom Inc. (NASDAQ:AVGO), Micron Technology (NASDAQ:MU), Advanced Micro Devices (NASDAQ:AMD), Intel Corp (NASDAQ:INTC), Lam Research Corp (NASDAQ:LRCX), Applied Materials (NASDAQ:AMAT), Texas Instruments (NASDAQ:TXN), KLA Corporation (NASDAQ:KLAC).

Industry description

The investment seeks daily investment results, before fees and expenses, of 300% of the daily performance of the ICE Semiconductor Index. The fund invests at least 80% of its net assets in financial instruments, such as swap agreements, securities of the index, and ETFs that track the index, that, in combination, provide 3X daily leveraged exposure to the index, consistent with the fund's investment objective. The index is a rules-based, modified float-adjusted market capitalization-weighted index that tracks the performance of the thirty largest U.S. listed semiconductor companies. The fund is non-diversified.

Market Cap

The average market capitalization across the Direxion Daily Semiconductor Bull 3X ETF (SOXL) ETF is 450.94B. The market cap for tickers in the group ranges from 21.27B to 5.53T. NVDA holds the highest valuation in this group at 5.53T. The lowest valued company is MTSI at 21.27B.

High and low price notable news

The average weekly price growth across all stocks in the Direxion Daily Semiconductor Bull 3X ETF (SOXL) ETF was 8%. For the same ETF, the average monthly price growth was 54%, and the average quarterly price growth was 211%. TER experienced the highest price growth at 13%, while CBRS experienced the biggest fall at -20%.

Volume

The average weekly volume growth across all stocks in the Direxion Daily Semiconductor Bull 3X ETF (SOXL) ETF was 31%. For the same stocks of the ETF, the average monthly volume growth was 28% and the average quarterly volume growth was -40%

Fundamental Analysis Ratings

The average fundamental analysis ratings, where 1 is best and 100 is worst, are as follows

Valuation Rating: 68
P/E Growth Rating: 34
Price Growth Rating: 34
SMR Rating: 51
Profit Risk Rating: 47
Seasonality Score: 39 (-100 ... +100)
View a ticker or compare two or three
SOXL
Daily Signal:
Gain/Loss:
Interact to see
Advertisement
A.I.Advisor
published price charts
A.I. Advisor
published General Information

General Information

Category Trading

Category
Trading--Leveraged Equity
Address
Direxion Shares ETF Trust33 Whitehall Street,10th FloorNew York
Phone
866-476-7523
Web
http://www.direxioninvestments.com/
Interact to see
Advertisement
Shares of TE are down approximately 13% in premarket trading on March 31, 2026, following the release of Q4 and full-year 2025 financial results before market open. The primary catalyst is a significant earnings miss: T1 Energy reported Q4 2025 EPS of -$0.70 per share, versus the consensus analyst estimate of +$0.05 — a deviation of roughly 1,500%.
PHR shares are plunging approximately 26.64% in premarket trading on March 31, 2026, falling from a prior close of $11.41 to $8.37. The primary catalyst is a significant downward revision to fiscal 2027 revenue guidance, cutting the midpoint outlook by roughly $37 million.
I've been following NVIDIA Corporation (NVDA) closely as it stands out as a leader in graphics processing units (GPUs) that drive artificial intelligence (AI), gaming, data centers, and autonomous vehicles. The company's business model centers on designing high-performance semiconductors and software platforms like CUDA, which builds an ecosystem that keeps developers and enterprises committed. With over 80% share in data center GPUs, NVIDIA has capitalized on surging demand for AI training and inference. From what I see, this strong positioning explains the recent stock behavior: solid fundamentals from AI growth are clashing with investor concerns about competition and the sustainability of spending, putting pressure on the share price even as revenues keep climbing.
Apple's fiscal second quarter, which ended around March 28, 2026, follows a strong Q1 where revenue reached a record $143.8 billion, up 16% year-over-year. That performance was driven by the best-ever quarter for the AAPL iPhone and solid Services growth. From what I see, this upcoming report is crucial because it will test whether the momentum from holiday upgrade cycles, AI-enhanced devices, and the 38% rebound in Greater China sales can continue. For investors like us, it provides key insights into supply chain resilience, the acceleration of Services with a 2.5 billion active device base, and Apple's ongoing capital returns—$25 billion in share repurchases last quarter alone. In a tech sector under scrutiny for margins and growth, Q2 will show if AAPL can keep outperforming.
Apple Inc. (AAPL) follows a conservative dividend policy, distributing quarterly cash dividends with a forward annual payout of $1.04 per share and a current yield of 0.42%. The latest quarterly dividend of $0.26 per share was declared on January 29, 2026, with an ex-dividend date of February 9, 2026, and payment on February 12, 2026. In my view, this modest yield positions AAPL not as a high-yield play or traditional dividend aristocrat, but as a solid dividend growth stock that emphasizes reinvestment in innovation and shareholder returns through buybacks. With trailing twelve months earnings per share (EPS) at $7.89, the low payout ratio leaves plenty of room for future increases while focusing on capital appreciation.
In my analysis of the tech sector, I often circle back to AAPL and MSFT, two companies that continue to define market leadership. Apple Inc. holds its ground in consumer hardware and services, while Microsoft Corporation powers ahead in cloud computing and enterprise software. For traders chasing short-term opportunities or investors building long-term positions, understanding their relative strengths—particularly with evolving dynamics in AI, cloud infrastructure, and product launches—proves essential. From what I see, this comparison sheds light on key metrics, developments, and positioning that can guide decisions in today's environment.
From what I see, NVIDIA commands a dominant position in the AI semiconductor space, holding an estimated 80-90% share of the AI accelerator market. This leadership is rooted in the CUDA software platform, which creates a proprietary ecosystem that makes it expensive and time-consuming for developers to switch to competitors. The company's full-stack offerings—covering GPUs, CPUs, networking, and software—allow it to deliver complete rack-scale AI supercomputers like the Blackwell NVL72, distinguishing it from rivals focused on individual chips.
APLS shares surged approximately +138.56% in premarket trading on March 31, 2026, from a prior close of $17.09 to a premarket price of approximately $40.77. The primary catalyst is a definitive acquisition agreement announced by Biogen (BIIB), which agreed to acquire all outstanding shares of Apellis for $41.00 per share in cash, representing an upfront equity consideration of approximately $5.6 billion.
Shares of CEG are declining approximately 7% intraday on March 31, 2026, from a prior close of $298.61 to roughly $277–$278. The primary catalyst is Constellation Energy's long-awaited Business and Earnings Outlook call, in which the company's 2026 adjusted EPS guidance midpoint of $11.50 per share came in below the Wall Street consensus estimate of $11.60 per share.
PEPG shares are down approximately 64% in intraday trading on March 31, 2026, from a prior close of $4.23 to roughly $1.52, building on steep after-hours losses recorded on March 30. The primary catalyst is deeply disappointing Phase 2 clinical trial data from the FREEDOM2-DM1 study of PGN-EDODM1, PepGen's lead asset for myotonic dystrophy type 1 (DM1) — the drug showed virtually no benefit over placebo at the tested dose.
CNTA shares surged approximately +45.32% in Tuesday's session, climbing from a prior close of $27.58 to approximately $40.08, driven entirely by a blockbuster acquisition announcement. Primary catalyst: Eli Lilly and Company (LLY) announced a definitive agreement to acquire Centessa Pharmaceuticals for $38.00 per share in cash, plus one contingent value right (CVR) worth up to $9.00 per share, for total potential consideration of up to $47.00 per share.
Meta Platforms, Inc. (META) runs some of the world's largest social media platforms, including Facebook, Instagram, WhatsApp, and Messenger. The company's core business model centers on digital advertising, which accounts for the vast majority of revenue, supplemented by emerging initiatives in AI and consumer hardware like smart glasses. In the competitive social media and internet content industry, Meta Platforms holds a dominant position with billions of monthly active users, giving it unparalleled data for targeted ads. This advertising strength initially buffered recent pressures, but exposure to regulatory scrutiny and heavy AI investments has contributed to the stock's downward price movement as investors weigh long-term growth against short-term costs. From what I see, this balance between scale and spending is one of the key tensions right now.
Microsoft Corporation (MSFT) stands as a powerhouse in technology, focusing on software, cloud computing, and productivity tools. At its core, the company relies on high-margin subscription services such as Microsoft 365, the Azure cloud platform, and growing AI features through Copilot. In the fiercely competitive software and cloud landscape, Microsoft commands over 30% market share in cloud infrastructure (IaaS/PaaS), second only to Amazon Web Services. What stands out to me are its solid fundamentals—recurring revenue makes up more than 70% of total sales, paired with strong free cash flow—that generally provide a buffer against volatility. That said, the recent price action has been driven by heavy AI-related capital expenditures and a slowdown in cloud growth, which are squeezing margins and testing investor patience in the short term.
Alphabet Inc. (GOOG), the parent of Google, continues to lead the digital advertising space with its search engine holding over 90% global market share. The company's model centers on targeted ads fueled by extensive user data, bolstered by high-margin areas like YouTube, Google Cloud Platform (GCP), and AI efforts such as the Gemini models. In my view, Alphabet's edge in the tech sector comes from its scaling cloud business and AI infrastructure leadership. These strengths provide a solid foundation, yet recent price action reveals sensitivities to regulatory pressures and hefty AI investments—explaining the decline even as Q4 2025 ad revenues grew robustly.
From what I see, Alphabet Inc. (GOOGL), the parent of Google, continues to lead in digital advertising while pushing deeper into cloud computing and AI. Its business model relies heavily on high-margin ad revenues from Search and YouTube, bolstered by growth in Google Cloud Platform (GCP) and AI services like Gemini. In the competitive tech landscape, Alphabet maintains over 90% global search market share, strong data advantages, and AI infrastructure leadership through custom TPUs. These strengths explain much of the recent stock action: steady ad demand provides a base, but substantial AI investments introduce volatility tied to capex and growth balances.
AMZN stock declined approximately -4% over the past 30 days amid concerns over elevated AI-driven capital expenditures pressuring margins. Over the past quarter, the stock fell around -13%, reflecting post-earnings selloff and broader tech sector volatility. Major drivers include surging AWS demand offset by high capex forecasts of up to $200 billion for 2026, macroeconomic pressures like trade policy risks, and geopolitical tensions impacting sentiment.
Meta Platforms holds a commanding presence in social media and digital advertising, drawing on powerful network effects from platforms like Facebook, Instagram, WhatsApp, and Messenger to reach over 3.5 billion daily active users. What stands out to me is how their advanced AI algorithms refine ad targeting and content recommendations, delivering superior return on ad spend for advertisers—Advantage+ campaigns, for instance, provide a $4.52 return per dollar invested. This gives META a clear advantage over competitors like TikTok and Snap, especially as AI helps offset challenges from Apple's privacy updates.
Tesla, Inc. (TSLA) stands as a leading electric vehicle (EV) manufacturer and energy solutions provider. The company designs, produces, and sells high-performance EVs including the Model 3, Model Y, Model S, Model X, and Cybertruck, alongside energy products like solar panels and Powerwall batteries. Its core business model revolves around direct-to-consumer sales, vertical integration in battery production, and software updates via over-the-air (OTA) capabilities, which enhance vehicle longevity and generate recurring revenue from features like Full Self-Driving (FSD).
Taiwan Semiconductor Manufacturing Company (TSM), the world's largest dedicated semiconductor foundry, produces advanced integrated circuits for fabless firms such as Nvidia (NVDA), Apple (AAPL), and AMD (AMD). Operating a pure-play foundry model, TSMC avoids chip design, focusing instead on manufacturing. It holds over 50% market share in critical advanced nodes like 3nm and 5nm, which power AI applications, smartphones, and high-performance computing.
Taiwan Semiconductor Manufacturing Company Limited (TSM) ADRs rose 4.68% in the most recent completed session, climbing from a prior close of $316.50 to $331.32. The move comes after a brief two‑day pullback and reflects renewed buying interest as investors refocus on TSMC’s role at the center of the AI chip supply chain.