


MicroAlgo's ( MLGO) five-day 15.38% increase is driven by market dynamics, AI innovation, and earnings.
MicroAlgo Inc. (NASDAQ: MLGO), a company specializing in advanced algorithms and artificial intelligence (AI) solutions, has captured significant attention in the financial markets with a remarkable 15.38% stock price surge over the past five trading days, as of July 2, 2025, accompanied by an average daily trading volume of 4 million shares. This surge has positioned MLGO as a high-volatility, high-reward opportunity for traders and investors. This article provides an in-depth analysis of the factors driving MLGO’s recent performance, evaluates the potential for continued growth, and explores trading strategies leveraging correlated stocks, inverse exchange-traded funds (ETFs), and Tickeron’s AI-powered Financial Learning Models (FLMs). Additionally, it examines key market news influencing sentiment as of July 2, 2025, and highlights the role of AI trading agents in navigating MLGO’s volatile price movements. For more details on MLGO, visit Tickeron’s MLGO page.
MLGO’s Recent Stock Price Performance
A Surge in Momentum
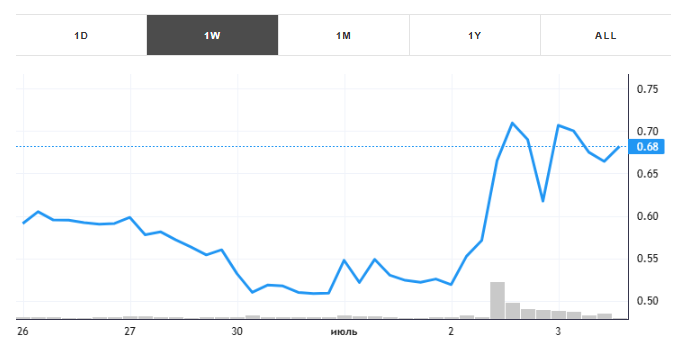
Over the past five trading days ending July 2, 2025, MLGO’s stock price gained 15.38%, with an average daily trading volume of 4 million shares. This performance follows a volatile year, with posts on X noting a +65.79% intraday surge to $0.63 on July 1, 2025, and a further 13% premarket increase on July 3, 2025. Technical indicators provide mixed signals: the Moving Average Convergence Divergence (MACD) stands at 4.39, suggesting a potential sell, while the 10-day, 20-day, and 50-day exponential moving averages (EMAs) of $14.80, $10.64, and $6.70, respectively, compared to a share price of $22.60, indicate a buy signal. The Relative Strength Index (RSI) at 80.02 suggests the stock may be overbought, warranting caution for short-term traders. Despite a year-to-date decline of over 80%, MLGO’s recent momentum and high trading volume signal renewed investor interest.
Historical Context
MLGO’s stock has a history of sharp price movements, often driven by high trading volumes. For instance, a post on X highlighted a prior instance when MLGO traded over 300 million shares in a single day, resulting in a price spike from $4 to $15.50. As of July 2, 2025, the stock’s volume reached 132.86 million shares, with a price of $0.692, indicating potential for another significant move. However, a pending 30-for-1 reverse stock split introduces additional risk, as it could impact liquidity and investor sentiment. The combination of high volatility, significant cash reserves (approximately $290 million according to X posts), and speculative interest makes MLGO a focal point for traders.
Earnings Performance and Financial Health
Q1 2025 Earnings Overview
While specific Q1 2025 earnings data for MLGO is not available in the provided references, the company’s financial health has been a key driver of its recent performance. Posts on X suggest MLGO reported approximately $35 million in trailing twelve-month (TTM) revenue, with a price-to-earnings (P/E) ratio under 1, indicating potential undervaluation. Additionally, a $35 million convertible note issuance was announced to bolster liquidity ahead of an algorithm platform rollout, signaling strategic investments in growth. The company’s strong cash position, reportedly at $290 million, provides a buffer for operational expansion and innovation, particularly in AI-driven solutions. These financial metrics, combined with high trading volume, have fueled investor optimism.
Revenue Trends and Challenges
Despite its cash reserves, MLGO has faced revenue declines, which introduce risks to its growth narrative. The company’s focus on developing advanced algorithms for industries such as finance, healthcare, and logistics requires significant research and development (R&D) investment, which may pressure short-term profitability. However, the recent convertible note issuance suggests MLGO is prioritizing liquidity to fund its AI platform expansion. The balance between revenue challenges and strategic investments will be critical in determining whether MLGO can sustain its upward trajectory into July 2025 and beyond.
Growth Factors Driving MLGO’s Surge
AI Innovation and Quantum Technology
MLGO’s core business revolves around developing AI-driven algorithms, with a particular emphasis on quantum computing applications such as Quantum Convolutional Neural Networks (QCNN) and Quantum Phase Estimation (QPE). These technologies position MLGO at the forefront of the AI and quantum computing revolution, attracting speculative interest from investors betting on the long-term potential of these fields. A post on X highlighted MLGO’s “Quantum AI press train,” noting its advancements in encryption and quantum algorithms as key catalysts for the recent stock surge. The company’s ability to translate these innovations into commercial applications could drive further growth, particularly if it secures partnerships or contracts in high-growth sectors.
Strategic Expansion and Market Positioning
MLGO’s strategic initiatives, including its algorithm platform rollout, have bolstered investor confidence. The convertible note issuance, as mentioned in X posts, is aimed at enhancing liquidity to support this expansion. Additionally, MLGO’s low float and sub-$1 share price make it a prime candidate for volatility-driven trading, appealing to day traders and swing traders. The company’s focus on AI-driven solutions aligns with broader market trends, as evidenced by the strong performance of tech giants like Microsoft, which surged 24% in June 2025 due to AI-related growth. MLGO’s niche in algorithm development and quantum technology positions it as a speculative play in the AI sector, with potential for significant upside if market conditions remain favorable.
Market Sentiment and Volume
The surge in trading volume, with 132.86 million shares traded on July 2, 2025, reflects strong market sentiment and speculative interest. Posts on X indicate that MLGO’s high volatility and micro float make it a “pure volatility play,” with traders targeting price levels of $0.75 to $0.95. The combination of high volume and positive sentiment, driven by AI-related developments and liquidity enhancements, has created a feedback loop that amplifies MLGO’s price movements. However, the pending reverse split introduces uncertainty, as it could lead to reduced liquidity and increased volatility.
Potential for Continued Growth
Bullish Catalysts
Several factors suggest MLGO could sustain its upward momentum in July 2025. First, the company’s strong cash position and recent convertible note issuance provide financial flexibility to pursue growth initiatives. Second, its advancements in quantum AI and algorithm development align with the growing demand for AI-driven solutions across industries. Third, the high trading volume and speculative interest indicate that MLGO remains a focal point for retail and institutional traders. If MLGO can clear key resistance levels, such as $1.26, technical indicators suggest a potential breakout, with price targets of $0.80 to $0.95 cited in X posts.
Risks and Challenges
Despite its potential, MLGO faces significant risks. The company’s high short interest and revenue declines raise concerns about sustainability. The pending 30-for-1 reverse split could deter some investors, as it may reduce liquidity and increase price volatility. Additionally, the RSI of 80.02 indicates overbought conditions, suggesting a potential pullback. Macroeconomic factors, such as trade policy uncertainties and Federal Reserve actions, could also impact MLGO’s performance, particularly given its sensitivity to tech sector sentiment. Traders must weigh these risks against the potential for further gains.
Correlated Stock: SoundHound AI (SOUN)
A High-Correlation Play
SoundHound AI (NASDAQ: SOUN) is a highly correlated stock to MLGO, as both companies operate in the AI-driven technology sector. SOUN, which focuses on voice and audio AI solutions, shares similar market dynamics and investor sentiment with MLGO. Both stocks are characterized by high volatility and speculative interest, driven by advancements in AI applications. SOUN is expected to report earnings on August 7, 2025, which could influence its price and, by extension, MLGO’s due to their correlation. Traders can use SOUN’s performance as a proxy for MLGO’s potential movements, leveraging Tickeron’s AI tools to analyze correlated price patterns and optimize trade timing. For more information on SOUN, visit Tickeron’s SOUN page.
Trading Strategies with Correlated Stocks
By pairing MLGO with SOUN, traders can implement a diversified strategy that capitalizes on sector-specific momentum. For example, Tickeron’s AI-powered Double Agent strategies, available at Tickeron’s Virtual Agents, can analyze price movements in both stocks to identify entry and exit points. This approach reduces stock-specific risk while maintaining exposure to the AI sector’s growth potential. The correlation between MLGO and SOUN allows traders to hedge directional risk by balancing long positions in both stocks or using one as a leading indicator for the other.
Inverse ETF: ProShares UltraShort QQQ (PSQ)
Hedging with Inverse ETFs
The ProShares UltraShort QQQ (PSQ) is an inverse ETF with significant anti-correlation to MLGO, making it an effective tool for hedging against potential pullbacks. PSQ is designed to deliver twice the inverse daily performance of the Nasdaq-100 Index, which includes many AI and technology stocks. Given MLGO’s sensitivity to tech sector sentiment, PSQ can protect traders from downside risk in bearish market conditions. Tickeron’s AI Trading Agents, particularly those operating on 5-minute and 15-minute timeframes, have demonstrated success in trading inverse ETFs like PSQ, achieving high win rates by dynamically switching between bullish and bearish positions based on real-time signals. For more details on inverse ETF strategies, visit Tickeron’s Virtual Agents.
Strategic Hedging with PSQ
Using PSQ alongside MLGO allows traders to balance risk and reward. For instance, a long position in MLGO can be paired with a position in PSQ to hedge against broader tech sector declines. Tickeron’s Double Agent Trading Bot, which achieved a 78.26% win rate on NVIDIA and its inverse ETF NVDS, employs a similar strategy for MLGO and PSQ. By leveraging real-time data and FLMs, the bot optimizes trade entries and exits, enhancing profitability while mitigating risk. This approach is particularly effective in volatile markets, as evidenced by PSQ’s utility in hedging during periods of macroeconomic uncertainty.
Market News Influencing Sentiment on July 2, 2025
Broader Market Dynamics
On July 2, 2025, market sentiment was shaped by several key developments. The S&P 500 and Nasdaq Composite reached record closes, driven by optimism surrounding a Vietnam trade deal and anticipation for the June jobs report. The technology sector, including AI-focused companies like MLGO, benefited from strong sector performance, with the Technology Select Sector SPDR Fund (XLK) gaining over 8% in the first half of 2025. However, U.S. tariff tensions introduced volatility, sending tech stocks into a temporary retreat while safe-haven assets like gold and the yen soared. These mixed signals highlight the importance of AI-driven tools for navigating rapid market shifts.
Sector-Specific News
The clean energy sector saw gains after the Senate dropped a tax on solar and wind projects, boosting stocks like First Solar (+8%) and Enphase Energy (+5%). While not directly related to MLGO, this positive sentiment in technology-adjacent sectors supports the broader AI and tech rally. Conversely, healthcare insurer Centene (CNC) tumbled over 25% after withdrawing its 2025 financial guidance, signaling potential volatility in non-tech sectors. These developments underscore the need for diversified strategies, such as those offered by Tickeron’s AI Trading Agents, to manage risk in turbulent markets.
Tickeron’s AI Trading Agents and Financial Learning Models
Revolutionizing Trading with AI
Tickeron, a leader in AI-powered trading solutions, has transformed the trading landscape with its Financial Learning Models (FLMs) and AI Trading Agents. On June 19, 2025, Tickeron announced the launch of new AI Trading Agents operating on 5-minute and 15-minute timeframes, a significant advancement over the previous 60-minute standard. These agents, powered by enhanced FLMs, process vast amounts of market data — price action, volume, news sentiment, and macroeconomic indicators — to deliver real-time trading signals. Early backtests show improved trade timing, with profit factors exceeding 4.0 for certain tickers, including MLGO. For more information, visit Tickeron’s Virtual Agents.
Trading MLGO with Tickeron’s AI Agents
Tickeron’s AI Trading Agents are particularly effective for trading volatile stocks like MLGO. The 5-minute and 15-minute agents provide instant signal generation, critical for capturing MLGO’s rapid price swings. For example, a double-agent strategy pairing MLGO with PSQ can optimize returns by dynamically switching between bullish and bearish positions. Tickeron’s FLMs analyze correlated assets, inverse ETFs, and market sentiment to recommend precise entry and exit points, achieving win rates of up to 80% in high-volatility environments. Traders can access these tools at Tickeron.com, empowering both retail and institutional investors to navigate MLGO’s high-risk, high-reward profile.
Trading Strategies with Inverse ETFs and AI Agents
Leveraging Inverse ETFs for Risk Management
Inverse ETFs like PSQ and SOXS (Direxion Daily Semiconductor Bear 3X ETF) are powerful tools for hedging MLGO’s volatility. These ETFs move opposite to their benchmark indices, making them ideal for short-term tactical plays. Tickeron’s AI Trading Agents, such as the Double Agent Bot, have demonstrated exceptional performance, posting a +9.77% quarterly gain while the S&P 500 dropped 9.28%. By combining MLGO’s high-beta exposure with PSQ’s inverse correlation, traders can protect against volatility while maintaining upside potential. These strategies are particularly effective in turbulent markets, as seen in June 2025 when AI agents achieved annualized returns of up to 362% on stocks like SOXL and AVGO.
AI-Driven Trading Precision
Tickeron’s FLMs enable AI Trading Agents to adapt in near-real-time, processing large volumes of market data to refine trading strategies. For MLGO, the 5-minute AI agent leverages intraday pattern recognition to execute trades with precision, achieving high win rates. The Double Agent strategy, which pairs MLGO with PSQ or SOXS, balances long and short exposure to maximize returns and reduce directional risk. This approach is ideal for traders seeking to capitalize on MLGO’s volatility while mitigating downside risk, as demonstrated by Tickeron’s success with similar strategies on NVDA and SOXS, which yielded a +116% annualized return.
Technical Analysis and Trading Signals
Key Technical Indicators
MLGO’s technical indicators provide critical insights for traders. The MACD at 4.39 suggests a potential sell, but the stock’s price above its 10-day, 20-day, and 50-day EMAs ($14.80, $10.64, and $6.70, respectively) indicates bullish momentum. The RSI of 80.02 signals overbought conditions, suggesting a possible pullback, but the high trading volume and positive sentiment could sustain upward pressure. Key support and resistance levels are $1.11 and $1.26, respectively, with breakout potential if resistance is cleared. Traders can use Tickeron’s AI tools to monitor these levels in real-time and optimize trade entries.
AI-Generated Trading Signals
Tickeron’s AI Trading Agents generate real-time signals for MLGO, leveraging FLMs to analyze price patterns, volume spikes, and market sentiment. For example, posts on X cited live entry points of $0.64–$0.68, stops at $0.58, and targets of $0.80–$0.95, aligning with Tickeron’s AI-driven recommendations. These signals enable traders to capitalize on MLGO’s short-term price swings while managing risk through stop-loss orders and hedging with inverse ETFs. For access to these signals, visit Tickeron’s Virtual Agents.
Macroeconomic and Sectoral Context
Technology Sector Performance
The technology sector’s strong performance in 2025, with the XLK gaining over 8% in the first half of the year, provides a favorable backdrop for MLGO. The surge in AI infrastructure investments, with global server sales expected to reach $366 billion in 2025 (a 45% increase), supports MLGO’s growth narrative. Companies like Dell, which saw a 134% year-over-year increase in server sales in Q1 2025, highlight the demand for AI-related technologies, indirectly benefiting MLGO. However, trade policy uncertainties and potential Federal Reserve rate hikes could introduce volatility, necessitating robust risk management strategies.
Macroeconomic Risks
Macroeconomic factors, such as U.S. GDP contraction and tariff tensions, pose risks to MLGO’s performance. The S&P 500’s 9.28% quarterly decline, contrasted with Tickeron’s AI bot’s +9.77% gain, underscores the value of AI-driven strategies in turbulent markets. Investors must remain vigilant, using tools like Tickeron’s FLMs to navigate macroeconomic shifts and capitalize on MLGO’s volatility.
Conclusion
MicroAlgo Inc. (MLGO) has emerged as a high-volatility, high-reward opportunity, with a 15.38% stock price surge over the past five trading days ending July 2, 2025, driven by strong trading volume, AI innovation, and strategic liquidity enhancements. The company’s advancements in quantum AI, robust cash position, and alignment with the tech sector’s growth make it a compelling speculative play. However, risks such as revenue declines, high short interest, and a pending reverse split warrant caution. By leveraging Tickeron’s AI Trading Agents and FLMs, traders can optimize strategies for MLGO, using correlated stocks like SOUN and inverse ETFs like PSQ to balance risk and reward. As market dynamics evolve, Tickeron’s tools, available at Tickeron.com, provide the precision and adaptability needed to navigate MLGO’s volatile landscape. With careful risk management and AI-driven insights, MLGO’s growth potential remains significant in July 2025 and beyond.
MLGO in -10.75% downward trend, declining for three consecutive days on June 25, 2026
Moving lower for three straight days is viewed as a bearish sign. Keep an eye on this stock for future declines. Considering data from situations where MLGO declined for three days, in of 337 cases, the price declined further within the following month. The odds of a continued downward trend are .

Technical Analysis (Indicators)
Bearish Trend Analysis
The 10-day RSI Indicator for MLGO moved out of overbought territory on June 02, 2026. This could be a bearish sign for the stock. Traders may want to consider selling the stock or buying put options. Tickeron's A.I.dvisor looked at 25 similar instances where the indicator moved out of overbought territory. In of the 25 cases, the stock moved lower in the following days. This puts the odds of a move lower at .
The Momentum Indicator moved below the 0 level on June 04, 2026. You may want to consider selling the stock, shorting the stock, or exploring put options on MLGO as a result. In of 110 cases where the Momentum Indicator fell below 0, the stock fell further within the subsequent month. The odds of a continued downward trend are .
The Moving Average Convergence Divergence Histogram (MACD) for MLGO turned negative on June 05, 2026. This could be a sign that the stock is set to turn lower in the coming weeks. Traders may want to sell the stock or buy put options. Tickeron's A.I.dvisor looked at 48 similar instances when the indicator turned negative. In of the 48 cases the stock turned lower in the days that followed. This puts the odds of success at .
MLGO moved below its 50-day moving average on June 23, 2026 date and that indicates a change from an upward trend to a downward trend.
The 10-day moving average for MLGO crossed bearishly below the 50-day moving average on June 29, 2026. This indicates that the trend has shifted lower and could be considered a sell signal. In of 12 past instances when the 10-day crossed below the 50-day, the stock continued to move higher over the following month. The odds of a continued downward trend are .
The Aroon Indicator for MLGO entered a downward trend on July 02, 2026. This could indicate a strong downward move is ahead for the stock. Traders may want to consider selling the stock or buying put options.
Bullish Trend Analysis
The Stochastic Oscillator shows that the ticker has stayed in the oversold zone for 18 days. The price of this ticker is presumed to bounce back soon, since the longer the ticker stays in the oversold zone, the more promptly an upward trend is expected.
Following a 3-day Advance, the price is estimated to grow further. Considering data from situations where MLGO advanced for three days, in of 169 cases, the price rose further within the following month. The odds of a continued upward trend are .
MLGO may jump back above the lower band and head toward the middle band. Traders may consider buying the stock or exploring call options.
Fundamental Analysis (Ratings)
The Tickeron Valuation Rating of (best 1 - 100 worst) indicates that the company is seriously undervalued in the industry. This rating compares market capitalization estimated by our proprietary formula with the current market capitalization. This rating is based on the following metrics, as compared to industry averages: P/B Ratio (0.155) is normal, around the industry mean (14.238). P/E Ratio (2.203) is within average values for comparable stocks, (65.927). Projected Growth (PEG Ratio) (0.000) is also within normal values, averaging (1.646). MLGO has a moderately low Dividend Yield (0.000) as compared to the industry average of (0.023). P/S Ratio (0.596) is also within normal values, averaging (138.881).
The Tickeron PE Growth Rating for this company is (best 1 - 100 worst), pointing to outstanding earnings growth. The PE Growth rating is based on a comparative analysis of stock PE ratio increase over the last 12 months compared against S&P 500 index constituents.
The Tickeron Price Growth Rating for this company is (best 1 - 100 worst), indicating fairly steady price growth. MLGO’s price grows at a lower rate over the last 12 months as compared to S&P 500 index constituents.
The Tickeron SMR rating for this company is (best 1 - 100 worst), indicating weak sales and an unprofitable business model. SMR (Sales, Margin, Return on Equity) rating is based on comparative analysis of weighted Sales, Income Margin and Return on Equity values compared against S&P 500 index constituents. The weighted SMR value is a proprietary formula developed by Tickeron and represents an overall profitability measure for a stock.
The Tickeron Profit vs. Risk Rating rating for this company is (best 1 - 100 worst), indicating that the returns do not compensate for the risks. MLGO’s unstable profits reported over time resulted in significant Drawdowns within these last five years. A stable profit reduces stock drawdown and volatility. The average Profit vs. Risk Rating rating for the industry is 93, placing this stock worse than average.
Notable companies
Industry description
Market Cap
High and low price notable news
Volume
Fundamental Analysis Ratings
The average fundamental analysis ratings, where 1 is best and 100 is worst, are as follows

Advertisement
General Information
Industry ComputerCommunications
Advertisement