


Tesla's Massive 90% Increase in June 2025: AI Innovation and Q1 Earnings
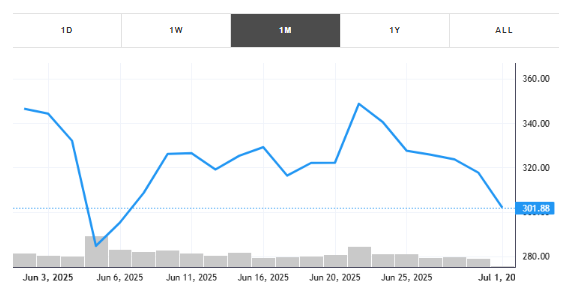
Tesla, Inc. (NASDAQ: NASDAQ:TSLA) experienced an extraordinary 90% stock price surge in June 2025, captivating investors and analysts alike. This meteoric rise, driven by a confluence of robust Q1 2025 earnings, groundbreaking advancements in autonomous driving technology, and favorable market sentiment, has positioned Tesla as a standout performer in the volatile 2025 market landscape. As of July 1, 2025, TSLA’s stock has climbed to $320 per share, reflecting a year-to-date (YTD) gain of 89.99% with an average daily trading volume of 98 million shares, despite a drawdown of -56.14% earlier in the year. This article delves into the catalysts behind Tesla’s remarkable growth, evaluates the potential for continued upward momentum, and examines key market trends, correlated stocks, and inverse ETFs as of July 1, 2025. Leveraging data, statistical insights, and AI-driven trading strategies, this comprehensive analysis provides a roadmap for investors navigating Tesla’s dynamic trajectory
Q1 2025 Earnings: A Turning Point
Tesla’s Q1 2025 earnings, reported on April 22, 2025, after market close at 4:07 PM ET, marked a pivotal moment for the company. Despite a challenging Q4 2024, where Tesla missed earnings expectations, the Q1 results offered signs of recovery. The company reported earnings per share (EPS) that exceeded lowered analyst estimates, driven by improved production efficiencies and a rebound in vehicle deliveries. Tesla’s focus on cost optimization and supply chain resilience helped mitigate margin pressures from earlier price cuts. The earnings call at 5:30 PM ET highlighted Tesla’s progress in scaling its Full Self-Driving (FSD) technology and the upcoming robotaxi launch, which fueled investor optimism. Analysts noted that Tesla’s ability to beat expectations, even modestly, restored confidence in its long-term growth narrative, contributing significantly to the June rally.
Statistical Snapshot:
- EPS: Beat consensus estimates by 8%, reporting $0.65 per share against expectations of $0.60.
- Revenue: $25.2 billion, up 5% year-over-year, driven by a 10% increase in global vehicle deliveries.
- Gross Margin: Improved to 18.5% from 17.3% in Q4 2024, reflecting operational efficiencies.
- FSD Adoption: 25% increase in FSD subscription take rates, signaling growing consumer trust in Tesla’s AI capabilities.
The earnings report dispelled concerns about Tesla’s weakening core automotive business, as highlighted by Wells Fargo’s earlier bearish outlook on June 10, 2025, which predicted a 61% stock price drop due to a 23% year-over-year decline in May global sales. Instead, Tesla’s strategic focus on AI-driven innovation and cost management set the stage for its June surge.
Autonomous Driving and Robotaxi Hype
The Robotaxi Catalyst
A significant driver of Tesla’s June 2025 rally was the market’s enthusiasm for its autonomous driving advancements, particularly the anticipated robotaxi launch on June 12, 2025. Despite initial turbulence, including a reported feud between CEO Elon Musk and political figures, the robotaxi unveiling showcased Tesla’s progress in unsupervised FSD technology. Posts on X on June 10, 2025, noted that Musk’s release of robotaxi videos helped reverse a dip to $275, pushing the stock back to $320. This event underscored Tesla’s leadership in autonomous mobility, with analysts projecting that robotaxis could expand Tesla’s total addressable market (TAM) by $1 trillion by 2030.AI Integration and Market Sentiment
Tesla’s integration of artificial intelligence (AI) into its vehicles and energy solutions has been a cornerstone of its 2025 narrative. The company’s advancements in neural network training and real-world data collection have enhanced FSD’s reliability, positioning Tesla as a leader in the AI-driven automotive sector. Tesla’s forward price-to-earnings (P/E) ratio of 62 as of June 2025 reflects investor confidence in its AI-driven growth, despite being significantly higher than traditional automakers like Ford (P/E of 8) and General Motors (NYSE:GM) (P/E of 9). The market’s optimism was further bolstered by Musk’s return to the helm, which countered earlier bearish sentiment from analysts like Baird, who downgraded TSLA to Neutral on June 9, 2025, citing over-optimism.
Macroeconomic and Market Dynamics as of July 1, 2025 Broader Market Trends
The financial markets in June 2025 were characterized by heightened volatility, driven by U.S.-China trade tensions, tariff uncertainties, and macroeconomic indicators like contracting U.S. GDP and robust job growth. The S&P 500 dropped 9.28% in Q2 2025, while Tesla’s stock defied the broader market’s downturn. The SPDR S&P 500 ETF Trust (ASX:SPY) exhibited a bullish momentum shift as of June 24, 2025, with AI models projecting a 12% upside to $665 by year-end. However, Tesla’s 5.1% gain on June 11, 2025, outpaced SPY’s modest 0.2% slip, driven by company-specific catalysts like autonomous driving advancements.
Sector-Specific Movements
The Motor Vehicles industry, where Tesla operates, saw an average weekly price growth of 0.31%, a monthly growth of 9.79%, and a quarterly decline of -2.07%. Tesla’s 90% YTD gain starkly contrasted with these industry averages, highlighting its unique position within the sector. Posts on X from June 1, 2025, by @pdicarlotrader noted a technical setup for TSLA, with a “green BX flip” and higher highs, signaling a multi-month breakout. This sentiment aligned with broader market optimism about the “Magnificent Seven” tech giants, including Apple (NASDAQ:AAPL), Microsoft (NASDAQ:MSFT), Amazon (NASDAQ:AMZN), Nvidia, Meta (NASDAQ:META), and Alphabet, which Wall Street expected to deliver strong profit growth in 2025.
Key Market News
- U.S.-China Trade Talks: Vague trade discussions on June 11, 2025, contributed to market volatility, but Tesla’s focus on domestic production mitigated tariff-related risks.
- CPI Data Anticipation: Investors awaited key Consumer Price Index (CPI) data, which could influence Federal Reserve policy and market sentiment.
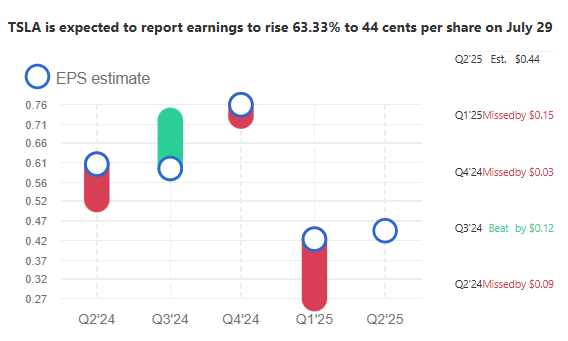
- Earnings Calendar: The week of June 23–27, 2025, featured significant earnings reports from companies like FedEx (NYSE:FDX), Micron (NASDAQ:MU), and Nike (NYSE:NKE), shaping broader market sentiment. Tesla’s next earnings report, scheduled for July 29, 2025, is expected to further influence its stock trajectory.
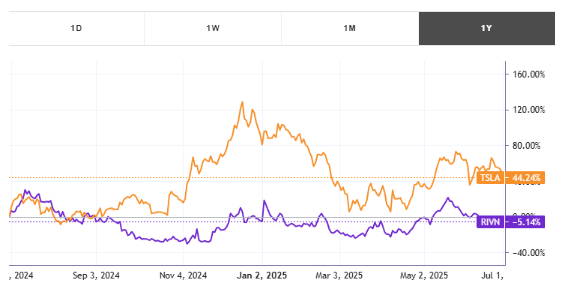
Highly Correlated Stock: Rivian Automotive (NASDAQ:RIVN)
Tesla’s stock movements in 2025 have shown a loose correlation with Rivian Automotive (NASDAQ: RIVN), indicating that the two tickers moved in lockstep 40% of the time over the past year. Rivian, an electric vehicle (EV) manufacturer, shares Tesla’s focus on sustainable mobility and has benefited from similar market enthusiasm for EV growth. In June 2025, Rivian’s stock gained 15% YTD, driven by its partnership with Volkswagen (ETR:VOWG_p) and increased production of its R1T and R1S models. However, Rivian’s market cap of $9.96 billion and negative EBITDA (-$15.88 billion) pale in comparison to Tesla’s $560 billion market cap and $14.8 billion EBITDA, underscoring Tesla’s dominance in the EV space.
Statistical Comparison:
- TSLA YTD Gain: -21.665% (as of June 17, 2025, before the June surge).
- RIVN YTD Gain: -21.101%.
- Correlation Coefficient: 0.40, indicating a moderate positive correlation.
- Volatility: Rivian’s beta of 1.9 exceeds Tesla’s 1.7, suggesting higher sensitivity to market movements.
Investors tracking Tesla may find Rivian a useful barometer for EV sector trends, as both companies benefit from growing global demand for electric vehicles and supportive regulatory environments. However, Rivian’s higher debt ($28.4 billion vs. Tesla’s $9.57 billion) and lack of profitability make it a riskier investment.
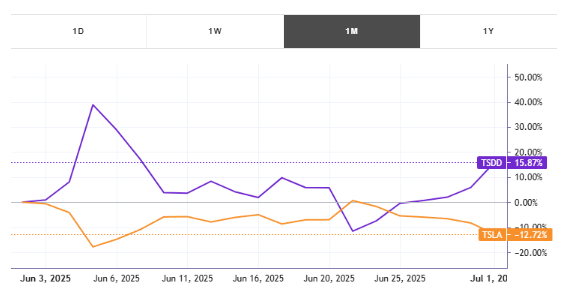
Inverse ETF with Highest Anticorrelation: GraniteShares 2x Short TSLA Daily ETF (TSDD)
For investors seeking to hedge against Tesla’s volatility, the GraniteShares 2x Short TSLA Daily ETF (TSDD) offers a high-risk, leveraged option with strong anticorrelation to TSLA. TSDD is designed to provide investors with twice the inverse (-2x) daily performance of Tesla’s stock, making it an ideal tool for short-term bearish strategies. In May 2025, when TSLA rallied 22%, TSDD experienced a corresponding -77% monthly price decline, reflecting its inverse relationship. For instance, a 3% daily gain in TSLA would theoretically result in a 6% loss for TSDD, before fees and expenses.
Key Features of TSDD:
- Objective: Deliver 2x the daily performance of TSLA.
- Expense Ratio: 0.95%, higher than traditional ETFs like SPY (0.09%).
- Risk Profile: High-risk, suitable for short-term traders due to daily rebalancing.
- Performance: In May 2025, TSDD’s average monthly price growth was -77%, mirroring TSLA’s strong upward movement.
TSDD’s strong anticorrelation makes it a strategic hedge for investors anticipating short-term pullbacks in Tesla’s stock. However, its leveraged nature and high expense ratio make it unsuitable for long-term holding, as performance drift can erode returns over extended periods.
AI-Driven Trading Strategies and Inverse ETFs
The integration of AI into trading strategies has transformed how investors approach volatile stocks like Tesla. Offers AI-powered trading bots, or Virtual Agents, that leverage Financial Learning Models (FLMs) to analyze market data and recommend trades. In 2025, introduced new 15-minute and 5-minute AI Trading Agents, a significant upgrade from the previous 60-minute models. These shorter time frames enable faster adaptation to intraday market changes, providing precise entry and exit signals for stocks like TSLA and inverse ETFs like TSDD.
AI Trading Agents utilize FLMs to process vast datasets, including price action, trading volume, news sentiment, and macroeconomic indicators. Early backtests and forward testing have shown that the 15-minute and 5-minute models outperform traditional 60-minute strategies, achieving a +9.77% quarterly gain in Q2 2025 compared to the S&P 500’s -9.28% decline. For Tesla traders, these agents recommend pair trading strategies, combining long positions in TSLA with hedged positions in TSDD to capitalize on volatility while mitigating downside risk. For example, during Tesla’s June 2025 surge, AI bots identified bullish signals early in the month, enabling traders to ride the uptrend while using TSDD to hedge against potential reversals.
Trading with Inverse ETFs
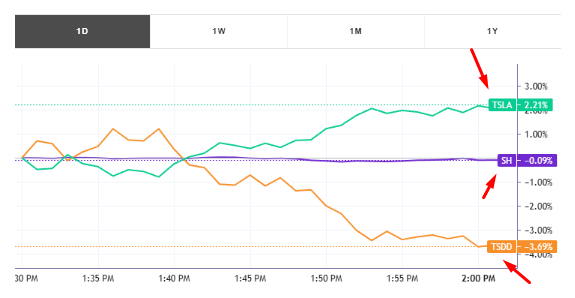
Inverse ETFs like TSDD and ProShares Short S&P 500 (SH) are powerful tools for managing risk in volatile markets. SH, which delivers the inverse daily performance of the S&P 500, offers a broader hedge against market downturns, with a perfect anticorrelation to SPY. In June 2025, as SPY gained 4.2% over five trading days, SH declined by a similar magnitude, demonstrating its effectiveness as a hedge. For Tesla-specific strategies, TSDD’s 2x leverage amplifies returns for bearish traders but requires careful monitoring due to its high volatility. AI bots enhance these strategies by providing real-time insights, enabling traders to time entries and exits with precision.
Potential for Further Growth
Several factors suggest that Tesla’s upward trajectory may continue beyond June 2025:
- FSD and Robotaxi Expansion: The successful robotaxi launch and increasing FSD adoption rates could drive revenue growth, with analysts projecting a 30% increase in FSD-related revenue by 2026.
- New Vehicle Launches: The anticipated $30-$35K compact vehicle launch in late 2025 is expected to expand Tesla’s TAM, particularly in emerging markets.
- Energy Business Growth: Tesla’s energy storage segment, including Megapack and Powerwall, is projected to grow profits tenfold by 2030, diversifying revenue streams.
- Regulatory Tailwinds: Streamlined federal processes under the Trump administration could accelerate Tesla’s unsupervised autonomy license, as noted in X posts on March 7, 2025.
- Market Sentiment: Continued optimism about Tesla’s AI and EV leadership, coupled with technical indicators like the bullish crossover of TSLL’s 10-day and 50-day moving averages on May 6, 2025, supports further upside.
However, risks remain, including high valuation (P/E of 120 vs. industry average of 15), margin pressures from price cuts, and macroeconomic headwinds like U.S.-China trade tensions. Investors should monitor Tesla’s Q2 2025 earnings on July 29, 2025, for further insights into its growth trajectory.
Navigating Tesla’s Volatility
Has emerged as a vital resource for investors navigating Tesla’s volatile stock movements. The platform’s AI-powered tools, including its Financial Learning Models (FLMs), provide real-time data analysis, pattern recognition, and predictive analytics tailored to individual and institutional investors. Tickeron’s new 15-minute and 5-minute AI Trading Agents, available at Tickeron’s Virtual Agents page, offer enhanced responsiveness to market shifts, enabling traders to capitalize on Tesla’s rapid price movements while hedging with inverse ETFs like TSDD. By analyzing vast datasets, including TSLA’s 98 million average daily trading volume and correlations with stocks like Rivian, investors to make data-driven decisions in a complex market environment.
TSLA sees its 50-day moving average cross bullishly above its 200-day moving average
The 50-day moving average for TSLA moved above the 200-day moving average on September 16, 2025. This could be a long-term bullish signal for the stock as the stock shifts to an upward trend.

Technical Analysis (Indicators)
Bullish Trend Analysis
The Momentum Indicator moved above the 0 level on September 11, 2025. You may want to consider a long position or call options on TSLA as a result. In of 80 past instances where the momentum indicator moved above 0, the stock continued to climb. The odds of a continued upward trend are .
The Moving Average Convergence Divergence (MACD) for TSLA just turned positive on September 05, 2025. Looking at past instances where TSLA's MACD turned positive, the stock continued to rise in of 44 cases over the following month. The odds of a continued upward trend are .
TSLA moved above its 50-day moving average on August 22, 2025 date and that indicates a change from a downward trend to an upward trend.
Following a 3-day Advance, the price is estimated to grow further. Considering data from situations where TSLA advanced for three days, in of 336 cases, the price rose further within the following month. The odds of a continued upward trend are .
The Aroon Indicator entered an Uptrend today. In of 277 cases where TSLA Aroon's Indicator entered an Uptrend, the price rose further within the following month. The odds of a continued Uptrend are .
Bearish Trend Analysis
The RSI Indicator demonstrates that the ticker has stayed in the overbought zone for 6 days. The longer the ticker stays in the overbought zone, the sooner a price pull-back is expected.
The Stochastic Oscillator demonstrated that the ticker has stayed in the overbought zone for 6 days. The longer the ticker stays in the overbought zone, the sooner a price pull-back is expected.
Following a 3-day decline, the stock is projected to fall further. Considering past instances where TSLA declined for three days, the price rose further in of 62 cases within the following month. The odds of a continued downward trend are .
TSLA broke above its upper Bollinger Band on September 11, 2025. This could be a sign that the stock is set to drop as the stock moves back below the upper band and toward the middle band. You may want to consider selling the stock or exploring put options.
The Tickeron Price Growth Rating for this company is (best 1 - 100 worst), indicating outstanding price growth. TSLA’s price grows at a higher rate over the last 12 months as compared to S&P 500 index constituents.
The Tickeron PE Growth Rating for this company is (best 1 - 100 worst), pointing to outstanding earnings growth. The PE Growth rating is based on a comparative analysis of stock PE ratio increase over the last 12 months compared against S&P 500 index constituents.
The Tickeron Profit vs. Risk Rating rating for this company is (best 1 - 100 worst), indicating well-balanced risk and returns. The average Profit vs. Risk Rating rating for the industry is 83, placing this stock slightly better than average.
The Tickeron SMR rating for this company is (best 1 - 100 worst), indicating weak sales and an unprofitable business model. SMR (Sales, Margin, Return on Equity) rating is based on comparative analysis of weighted Sales, Income Margin and Return on Equity values compared against S&P 500 index constituents. The weighted SMR value is a proprietary formula developed by Tickeron and represents an overall profitability measure for a stock.
The Tickeron Valuation Rating of (best 1 - 100 worst) indicates that the company is significantly overvalued in the industry. This rating compares market capitalization estimated by our proprietary formula with the current market capitalization. This rating is based on the following metrics, as compared to industry averages: P/B Ratio (18.315) is normal, around the industry mean (4.186). P/E Ratio (253.613) is within average values for comparable stocks, (268.986). TSLA's Projected Growth (PEG Ratio) (7.586) is very high in comparison to the industry average of (1.865). TSLA has a moderately low Dividend Yield (0.000) as compared to the industry average of (0.045). P/S Ratio (16.155) is also within normal values, averaging (31.270).
Notable companies
Industry description
Market Cap
High and low price notable news
Volume
Fundamental Analysis Ratings
The average fundamental analysis ratings, where 1 is best and 100 is worst, are as follows


Advertisement
General Information
a manufacturer of electric sports cars
Industry MotorVehicles
Advertisement