Real Time Patterns (RTP)
- Set up pattern search criteria
- Receive patterns in your feed
Real-time pattern trading is a smart way to find entry and exit prices if you can scan thousands of stocks and ETFs within minutes. It is definitely impossible for humans. Artificial Intelligence (A.I.) not only discovers these patterns, but also checks if they worked out well in the past. Knowing the success rate in the past allows A.I. to establish the odds of success in the future.


Triangle Ascending


The Ascending Triangle pattern forms when the price of a security tests a resistance level and creates a horizontal top line (1, 3, 5), with an upward-sloping bottom line (2, 4) formed by a rising support level. The breakout can either be up or down, and it will determine whether the target price is higher or lower.
This pattern is commonly associated with directionless markets, since the contraction (narrowing) of the market range signals that neither bulls nor bears are in control. When the price of a security consolidates around a certain level, it may indicate growing investor confidence for a significant uptrend.
Trade idea
Once price breaks outside of the triangle, day traders and swing traders should trade with an UP trend. Consider buying a security at the upward breakout level. To identify an exit, compute the target price by adding the pattern height to the breakout point. For upward breakouts, the level is the top horizontal line (1, 3, 5). The pattern height can be calculated by taking the difference between the resistance level set by the horizontal line, and the lowest low.
To limit potential loss when price suddenly goes in the wrong direction, consider placing a stop order to sell at or below the breakout price.
Time frames No matter your trading strategy (day trading, swing, etc), we have patterns that will be ready to trade.
Triangle Ascending (Bullish)
89.99 USD CURRENT PRICE
DIOD - Diodes, Inc.
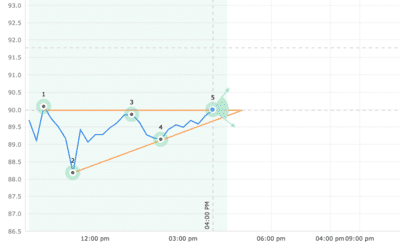
| STATUS | Emerged |
|---|---|
| CURRENT CONFIDENCE | 57% |
| TARGET (EXIT) PRICE | 91.78 USD |
| BREAKOUT (ENTRY) PRICE | 89.98 USD |
| DISTANCE TO TARGET PRICE | 1.99% |
| EMERGED ON | Aug 06, closing price |
| WITH CONFIDENCE LEVEL | 57% |
Statistics for ‘Triangle Ascending‘
Triangle Ascending (Bullish)
120.23 USD CURRENT PRICE
LSI - Life Storage Inc - Registered Shares
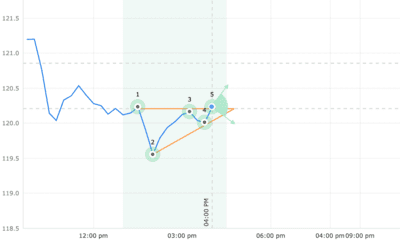
| STATUS | Emerged |
|---|---|
| CURRENT CONFIDENCE | 59% |
| TARGET (EXIT) PRICE | 120.86 USD |
| BREAKOUT (ENTRY) PRICE | 120.86 USD |
| DISTANCE TO TARGET PRICE | 0.52% |
| EMERGED ON | Aug 06, closing price |
| WITH CONFIDENCE LEVEL | 59% |
Statistics for ‘Triangle Ascending‘
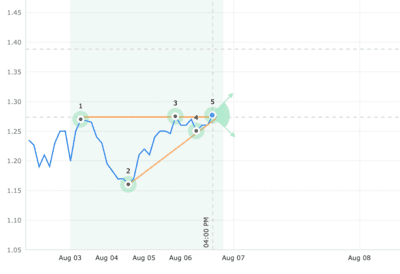
Triangle Ascending (Bullish)
1.28 USD CURRENT PRICE
IFMK - iFresh Inc

| STATUS | Emerged |
|---|---|
| CURRENT CONFIDENCE | 64% |
| TARGET (EXIT) PRICE | 1.39 USD |
| BREAKOUT (ENTRY) PRICE | 1.27 USD |
| DISTANCE TO TARGET PRICE | 8.70% |
| EMERGED ON | Aug 06, closing price |
| WITH CONFIDENCE LEVEL | 51% |
Statistics for ‘Triangle Ascending‘
Triangle Ascending (Bullish)
15.30 USD CURRENT PRICE
VRRM - Verra Mobility Corp - Ordinary Shares - Class A
| STATUS | Emerged |
|---|---|
| CURRENT CONFIDENCE | 59% |
| TARGET (EXIT) PRICE | 15.50 USD |
| BREAKOUT (ENTRY) PRICE | 15.29 USD |
| DISTANCE TO TARGET PRICE | 1.33% |
| EMERGED ON | Aug 06, closing price |
| WITH CONFIDENCE LEVEL | 61% |
Statistics for ‘Triangle Ascending‘
Triangle Ascending (Bullish)
7.87 USD CURRENT PRICE
LOMA - Loma Negra Compania Industrial Argentina Sociedad Anonima - ADR
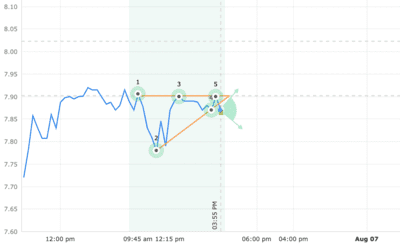
| STATUS | Emerged |
|---|---|
| CURRENT CONFIDENCE | 58% |
| TARGET (EXIT) PRICE | 8.02 USD |
| BREAKOUT (ENTRY) PRICE | 7.90 USD |
| DISTANCE TO TARGET PRICE | 1.95% |
| EMERGED ON | Aug 06, 03:45 PM (EDT) |
| WITH CONFIDENCE LEVEL | 56% |