Real Time Patterns (RTP)
- Set up pattern search criteria
- Receive patterns in your feed
Real-time pattern trading is a smart way to find entry and exit prices if you can scan thousands of stocks and ETFs within minutes. It is definitely impossible for humans. Artificial Intelligence (A.I.) not only discovers these patterns, but also checks if they worked out well in the past. Knowing the success rate in the past allows A.I. to establish the odds of success in the future.


Wedge Falling


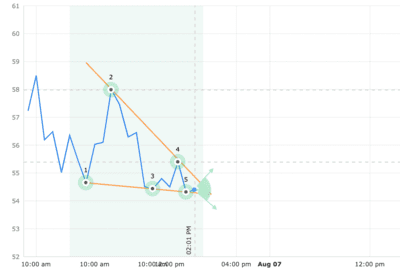
The Falling Wedge pattern forms when the price of a security appears to be spiraling downward, and two down-sloping lines are created with the price hitting lower lows (1, 3, 5) and lower highs (2, 4). The two pattern lines intersect to form a narrow triangle. Unlike Descending Triangle patterns, however, both lines need to have a distinct downward slope, with the top line having a steeper decline.
This pattern is commonly associated with directionless markets since the contraction (narrowing) of the market range signals that neither bulls nor bears are in control. However, there is a distinct possibility that market participants will either pour in or sell out, and the price can move up or down with big volumes (leading up to the breakout).
Trade Idea
If the price breaks out from the top pattern boundary, day traders and swing traders should trade with an UP trend. Consider buying a security or a call option at the breakout point. To identify an exit, set the target price as the top of the formation (the highest high). The confirmation move is when the price breaks out of the last high touching the top line.
To limit potential loss when price suddenly goes in the wrong direction, consider placing a stop order to sell at or below the breakout price.
Time frames No matter your trading strategy (day trading, swing, etc), we have patterns that will be ready to trade.
Wedge Falling (Bullish)
52.95 USD CURRENT PRICE
PHM - PulteGroup Inc
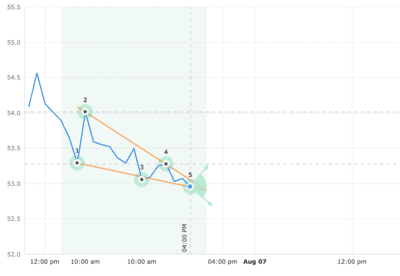
| STATUS | Emerged |
|---|---|
| CURRENT CONFIDENCE | 55% |
| TARGET (EXIT) PRICE | 54.01 USD |
| BREAKOUT (ENTRY) PRICE | 53.27 USD |
| DISTANCE TO TARGET PRICE | 2.00% |
| EMERGED ON | Aug 06, closing price |
| WITH CONFIDENCE LEVEL | 55% |
Statistics for ‘Wedge Falling‘
Wedge Falling (Bullish)
63.39 USD CURRENT PRICE
BBL - BHP Group Plc - ADR
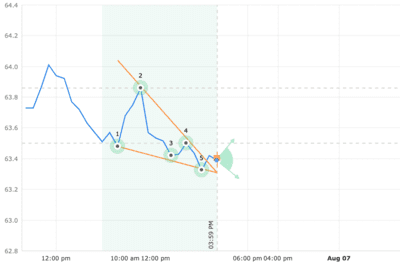
| STATUS | Emerged |
|---|---|
| CURRENT CONFIDENCE | 55% |
| TARGET (EXIT) PRICE | 63.86 USD |
| BREAKOUT (ENTRY) PRICE | 63.50 USD |
| DISTANCE TO TARGET PRICE | 0.74% |
| EMERGED ON | Aug 06, 03:00 PM (EDT) |
| WITH CONFIDENCE LEVEL | 55% |
Statistics for ‘Wedge Falling‘
Wedge Falling (Bullish)
42.08 USD CURRENT PRICE
STM - ST Microelectronics - New York Shares
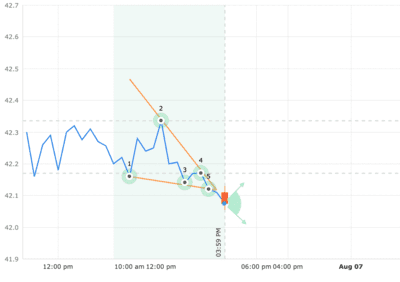
| STATUS | Emerged |
|---|---|
| CURRENT CONFIDENCE | 51% |
| TARGET (EXIT) PRICE | 42.34 USD |
| BREAKOUT (ENTRY) PRICE | 42.17 USD |
| DISTANCE TO TARGET PRICE | 0.62% |
| EMERGED ON | Aug 06, 03:00 PM (EDT) |
| WITH CONFIDENCE LEVEL | 54% |
Statistics for ‘Wedge Falling‘
Wedge Falling (Bullish)
241.13 USD CURRENT PRICE
V - Visa Inc - Ordinary Shares - Class A
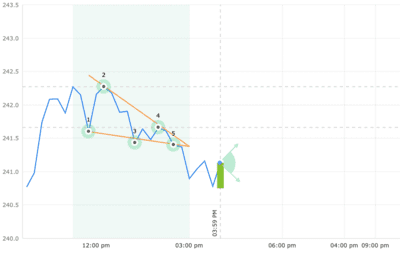
| STATUS | Emerged |
|---|---|
| CURRENT CONFIDENCE | 52% |
| TARGET (EXIT) PRICE | 242.27 USD |
| BREAKOUT (ENTRY) PRICE | 241.66 USD |
| DISTANCE TO TARGET PRICE | 0.47% |
| EMERGED ON | Aug 06, 02:30 PM (EDT) |
| WITH CONFIDENCE LEVEL | 56% |
Statistics for ‘Wedge Falling‘
Wedge Falling (Bullish)
54.40 USD CURRENT PRICE
UAN - CVR Partners LP - Unit
| STATUS | Emerged |
|---|---|
| CURRENT CONFIDENCE | 54% |
| TARGET (EXIT) PRICE | 57.99 USD |
| BREAKOUT (ENTRY) PRICE | 55.40 USD |
| DISTANCE TO TARGET PRICE | 6.61% |
| EMERGED ON | Aug 06, 02:00 PM (EDT) |
| WITH CONFIDENCE LEVEL | 55% |