


AI Robots: Top 10 Swing Traders, Virtual Accounts
Swing Trader: Tracking Dip Trends in Industrial Stocks ($20k per position) (TA)
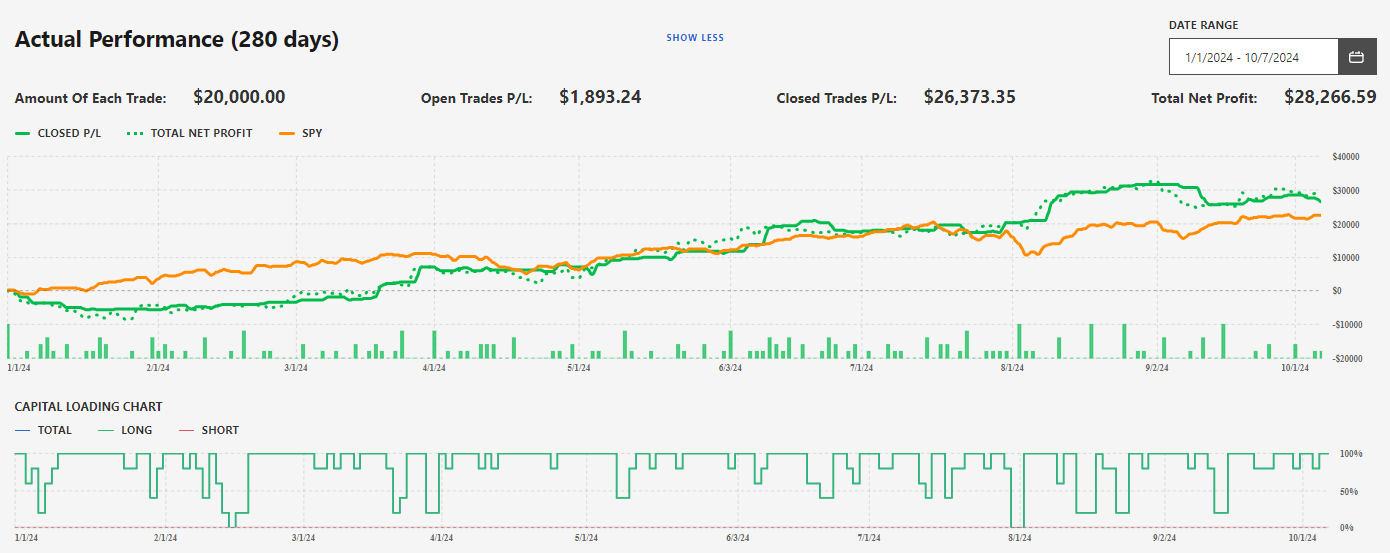
The "Dip Searcher" is an AI-powered trading robot designed to assist traders of all experience levels in engaging with the top 10 most influential companies within the S&P 500. By targeting these market giants, it provides a stable and less risky trading approach by taking advantage of major market dips. The bot places trades just before the market closes, utilizing the stock market’s mean-reversion tendencies to fine-tune entry and exit points. With a limit of five open positions, it takes a concentrated approach to managing risk. The Dip Searcher is ideal for those looking to invest in large-cap stocks using a long-only strategy, especially during periods of moderate market volatility.
Click to view the full description and closed trades for free!
Swing Trader: Analyzing Dip Trends in Real Estat ($20k per position) (TA)
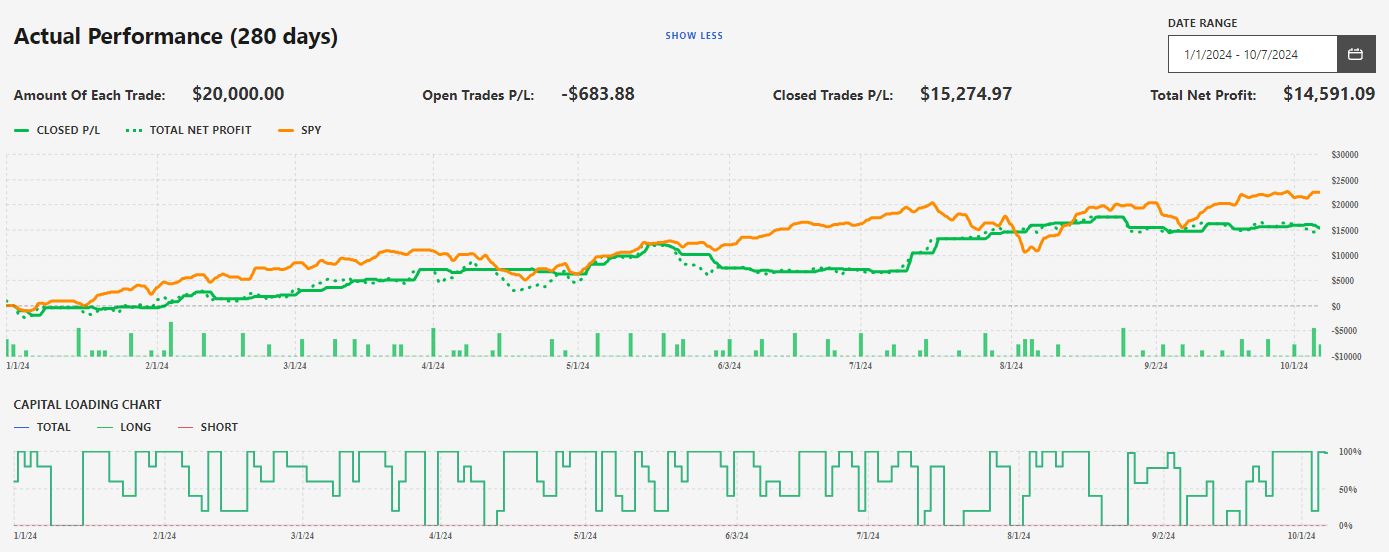
The AI Robot is an advanced trading tool designed for traders at all levels, focusing on the top 10 largest companies in the S&P 500 to harness their stability and influence on the market. It operates via the Alpaca brokerage platform, using sophisticated price action analysis to pinpoint prime trading opportunities during major market dips, executing trades near market close to take advantage of mean-reversion patterns. With a maximum of five open positions at a time, it adjusts exits based on favorable price movements rather than fixed profit goals, ensuring a balanced, medium-volatility approach. This long-only strategy offers exposure to large-cap stocks, making it an excellent choice for traders looking to manage medium-volatility markets with precision and reduced risk.
Click to view the full description and closed trades for free!
Swing Trader: Analyzing Dip Trends in High-Tech ($20k per position) (TA)

The AI Robot is a highly sophisticated trading tool designed for traders of all skill levels, focusing on the top 10 largest companies in the S&P 500. By concentrating on these industry giants, it taps into the stability and market influence of large-cap stocks. Using advanced price action analysis, the robot identifies prime trading opportunities during significant market dips, executing trades near market close to take advantage of mean-reversion patterns. It limits itself to a maximum of five open positions at a time, allowing for strategic and focused trading. Instead of relying on fixed profit targets, it exits trades based on favorable price movements. This strategy is well-suited for medium volatility markets, providing exposure to large-cap stocks through a long-only approach on the Alpaca brokerage platform.
Click to view the full description and closed trades for free!
Swing Trader, Popular Stocks ($4K per position): Short Bias Strategy (TA&FA)
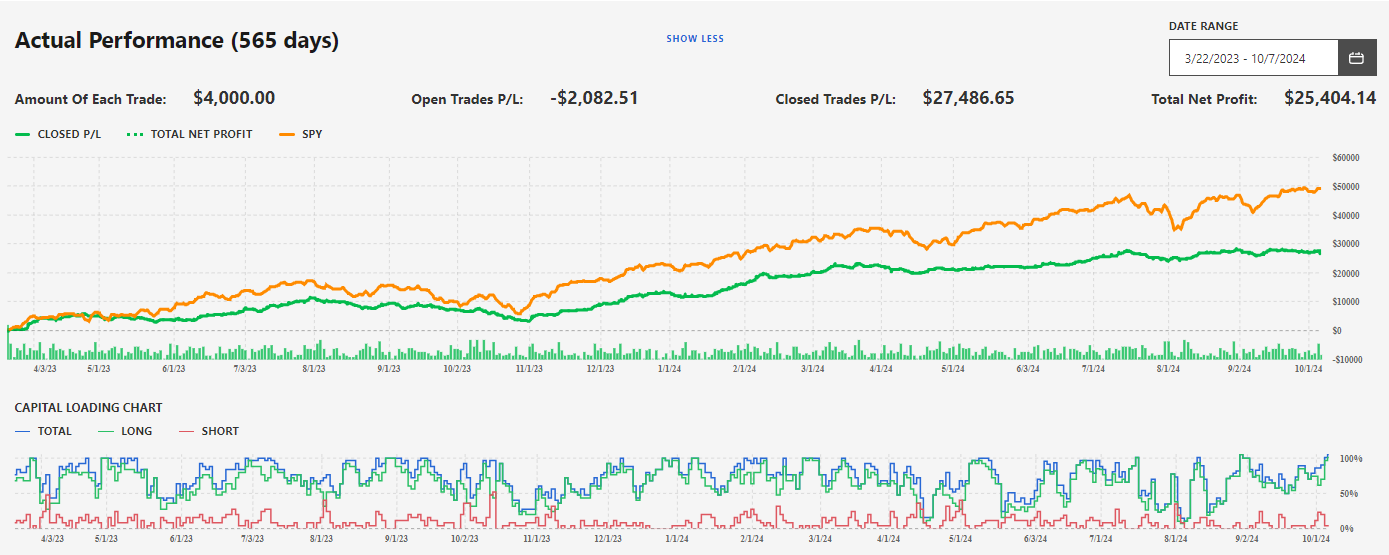
This AI robot is designed for traders who focus on highly liquid, popular stocks with low spreads and tend to take short positions. By leveraging a combination of algorithms, it pinpoints potential reversal points during uptrends, making it particularly useful in times of market volatility. It applies different strategies for long and short trades, using fixed take-profit and stop-loss levels for long positions, while implementing a flexible trailing stop for shorts to optimize gains during reversals. The robot employs a proprietary method to evaluate momentum strength in active U.S. stocks, balancing short and long positions to stay adaptable to market shifts. Ideal for active swing traders managing multiple trades at once, with an average trade duration of about two days, it offers moderate volatility and diversification, aiming for a balanced profit-to-drawdown ratio without relying on margin.
Click to view the full description and closed trades for free!
Swing Trader, Popular Stocks ($3K per position): Short Bias Strategy (TA&FA)
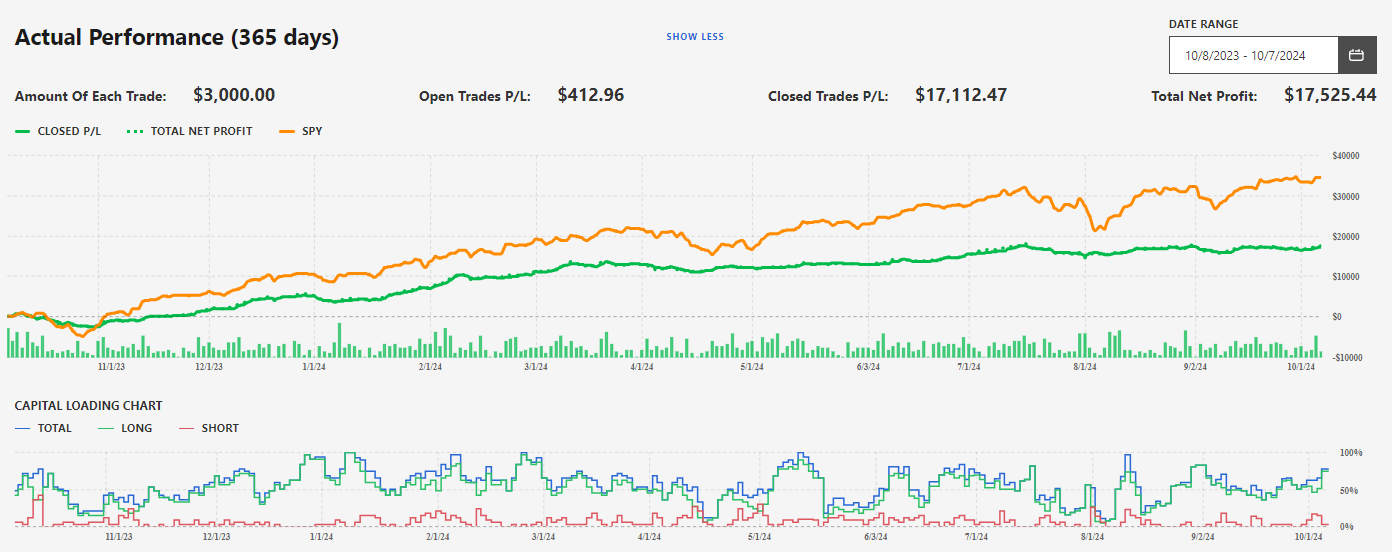
This AI robot is designed for traders who target popular stocks with high liquidity and tight spreads, often focusing on short positions to profit from trend reversals during market volatility. It uses a combination of algorithms and technical indicators to pinpoint ideal entry points while balancing short and long positions to adapt to shifting market trends. The robot's risk management strategy is tailored for a $100,000 balance, trading $3,000 per position, but can be adjusted to fit any account size. For long positions, it sets a 5.5% take profit and a 3% stop loss, while short trades have a 2.5% target for both, with a flexible trailing stop to lock in gains during reversals. Designed for active swing traders handling up to 50 trades at once, the average trade lasts about two days, making it beginner-friendly. Users can track live trades and review past performance on the platform, which includes detailed statistics and equity charts without relying on margin. The robot keeps a moderate level of open positions, volatility, and profit-to-dip ratio, with a medium-high diversification score, making it well-suited for medium volatility markets.
Click to view the full description and closed trades for free!
Swing Trader ($4K per position): High Volatility Stocks for Active Trading (TA&FA)

This AI trading robot is specifically designed for traders who focus on high-volatility stocks but want to limit losses during market downturns. It uses a unique method to assess the momentum strength and quality of the most active U.S. stocks, relying on a sophisticated algorithm that blends technical indicators with neural networks to pinpoint the best entry points. Built with a basic risk management strategy for a $100,000 trading account, it adjusts position sizes as the balance fluctuates. The system sets a take-profit target at 3.5% above the entry price and a stop-loss at 3% below, while also using a flexible trailing stop to lock in gains in reversing markets. Tailored for active traders handling 30-40 trades at once, the robot offers medium volatility and diversification, aiming for a balanced profit-to-drawdown ratio.
Click to view the full description and closed trades for free!
Swing Trader ($2.5K per position): High Volatility Stocks for Active Trading (TA&FA)

This AI trading robot is designed for traders who prefer high-volatility stocks but aim to limit losses during downturns. It uses a proprietary system created by quantitative analysts to evaluate momentum strength in active U.S. stocks. By combining technical indicators and neural networks, it identifies precise entry and exit points. The robot's risk management strategy is tailored for a $100,000 trading account, with $2,500 allocated per trade, adjusting proportionally as the account balance changes. Ideal for active traders handling 40-50 trades at once, it usually holds positions for a single day. Exit strategies include a fixed 3.5% take-profit, a 3% stop loss, and a flexible trailing stop to secure profits during market reversals.
Click to view the full description and closed trades for free!
Swing Trader ($3K per position): Medium Volatility Stocks for Active Trading (TA&FA)
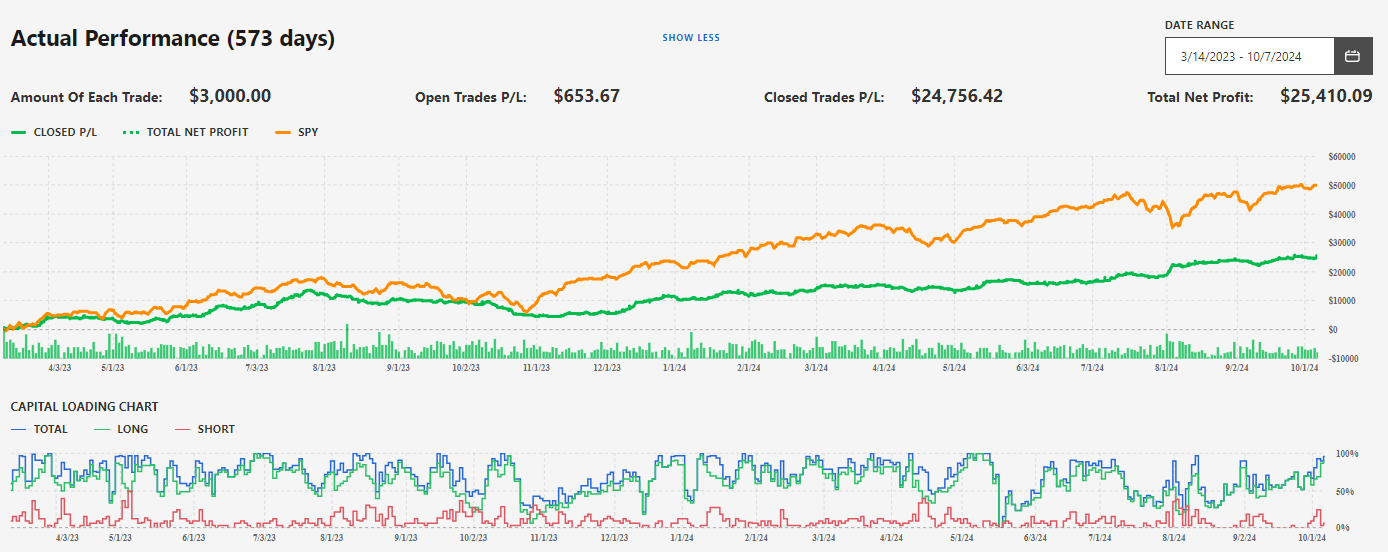
The AI Robot is a cutting-edge trading tool designed for active traders who focus on medium-volatility stocks and want to reduce losses during market downturns. It uses a unique stock selection method, created by a team of quantitative analysts, to evaluate the strength and quality of momentum in the most actively traded U.S. stocks. By analyzing various technical indicators through neural networks, the robot pinpoints ideal entry points and maintains a balance between short and long positions to avoid extended drawdowns. Built for a trading balance of $100,000 and a $3,000 position size—customizable by the user—it ensures effective use of capital with an average trade duration of two days and the ability to monitor 40-50 trades at once. The robot incorporates strong risk management measures, including fixed "Take Profit" levels at 4-5%, stop losses at 3%, and adjustable trailing stops to lock in gains if the market shifts.
.Click to view the full description and closed trades for free!
Swing Trader ($1.5K per position): Medium Volatility Stocks for Active Trading (TA&FA)
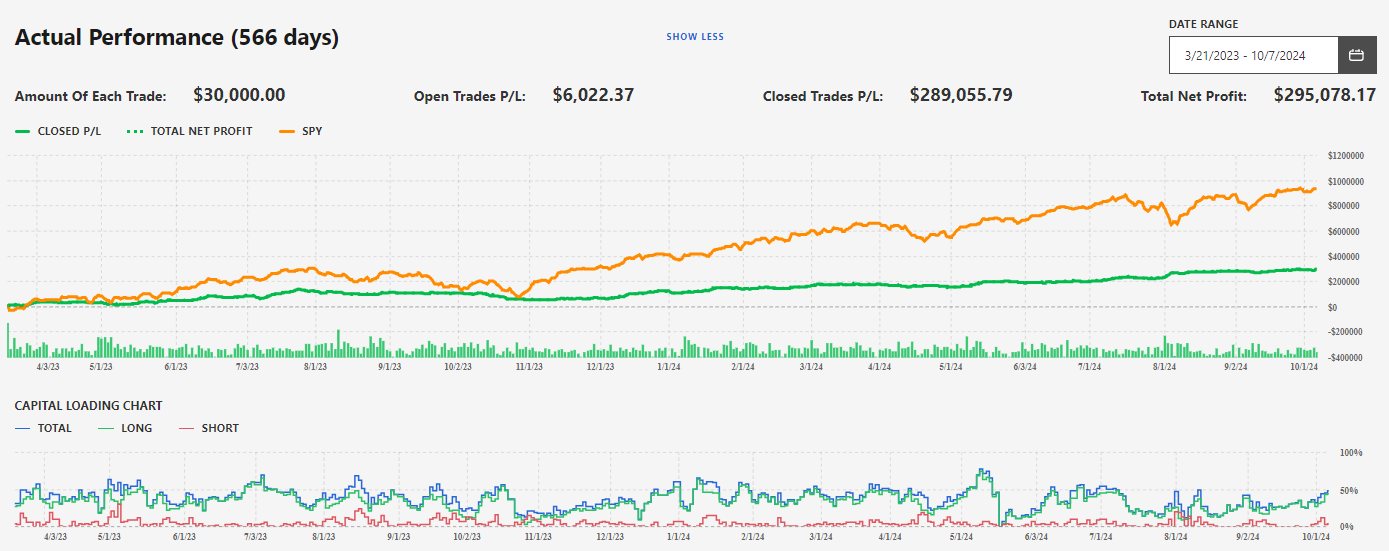
The AI Robot is a sophisticated trading tool designed for active traders who want to profit from medium-volatility stocks while minimizing losses during market downturns. It uses a proprietary stock selection system developed by quantitative analysts, powered by a complex algorithm that combines multiple technical indicators processed through neural networks to pinpoint the best entry and exit points. The risk management strategy is based on a $100,000 trading balance, with each trade set at $1,500, adjusting as the balance changes. With an average trade duration of two days and the ability to handle 40-50 trades at once, it’s perfect for traders managing multiple positions. Key features include a fixed take profit target of 4-5% of the opening price, a stop loss set at 3%, and a flexible trailing stop to lock in profits during market reversals. With medium volatility and a medium-high diversification score, the AI Robot offers a balanced strategy for intermediate and expert traders looking to maximize gains while managing risk.
Click to view the full description and closed trades for free!
Swing trader ($4.5K per position): Downtrend Protection v.2 (TA)

This trading robot is designed for traders working with a variety of stocks and looking for improved downside protection through advanced reversal filters. It leverages stocks with different levels of volatility—high, medium, and low—to create opportunities in any market condition, even during periods of low activity. With ongoing market volatility in mind, the robot uses complex algorithms to pinpoint the best times for opening short positions. Each day, it analyzes price movements using a unique combination of technical indicators, like Envelopes and Parabolic SAR, with customized settings to choose the right strategy for each stock and market situation. It also comes with a risk management system optimized for a $100,000 balance, allocating $4,500 per trade, and adjusts accordingly for different account sizes. Typically, trades last one day, utilizing fixed take-profit targets based on volatility, a 3% stop loss, and a flexible trailing stop to lock in profits during market reversals.
Click to view the full description and closed trades for free!
Summary
The article offers a detailed look at the top 10 AI-powered swing trading robots available on virtual accounts as of October 2024. These advanced tools are designed for traders at any skill level, focusing on various sectors like industrial stocks, real estate, high-tech, and highly liquid popular stocks. By leveraging a mix of technical and fundamental analysis, the robots use proprietary algorithms and neural networks to pinpoint ideal trading opportunities, manage risks, and take advantage of market pullbacks and reversals. With position sizes ranging from $1,500 to $20,000 and personalized risk management strategies, they offer diverse trading approaches, including long-only, short-bias, and methods that protect against downtrends. These AI robots are well-suited for traders seeking to maximize returns while minimizing risk in the medium to high-volatility markets.
Contributor
Sergey Savastiouk, Ph.D. has a degree in Applied Mathematics from Moscow University and has extensive experience as an entrepreneur, investor, manager, and mathematician. His professional expertise is in applied mathematics, mathematical modeling, system and pattern analysis, and software and hardware system integration. He has served as the CEO of several hi-tech start-up companies and nonprofit organizations, which has given him proven capabilities in business strategy for high-tech start-up companies, market assessment, company formation, team building, product development, marketing, and sales. He has published numerous articles in journals and magazines on related fields. As a retail investor, he spent 15 years developing his proprietary trading and quantitative algorithms (now Tickeron’s A.I.), which brought him significant returns in trading the stock market. His current work and goal in founding Tickeron is to bring professional, sophisticated stock market analysis capabilities to retail investors via an easy-to-use interface.
SPY in upward trend: 10-day moving average moved above 50-day moving average on August 05, 2026
The 10-day moving average for SPY crossed bullishly above the 50-day moving average on August 05, 2026. This indicates that the trend has shifted higher and could be considered a buy signal. In of 15 past instances when the 10-day crossed above the 50-day, the stock continued to move higher over the following month. The odds of a continued upward trend are .

Technical Analysis (Indicators)
Bullish Trend Analysis
The Momentum Indicator moved above the 0 level on July 31, 2026. You may want to consider a long position or call options on SPY as a result. In of 74 past instances where the momentum indicator moved above 0, the stock continued to climb. The odds of a continued upward trend are .
The Moving Average Convergence Divergence (MACD) for SPY just turned positive on August 03, 2026. Looking at past instances where SPY's MACD turned positive, the stock continued to rise in of 51 cases over the following month. The odds of a continued upward trend are .
SPY moved above its 50-day moving average on July 31, 2026 date and that indicates a change from a downward trend to an upward trend.
Following a 3-day Advance, the price is estimated to grow further. Considering data from situations where SPY advanced for three days, in of 366 cases, the price rose further within the following month. The odds of a continued upward trend are .
Bearish Trend Analysis
The 10-day RSI Indicator for SPY moved out of overbought territory on August 05, 2026. This could be a bearish sign for the stock. Traders may want to consider selling the stock or buying put options. Tickeron's A.I.dvisor looked at 46 similar instances where the indicator moved out of overbought territory. In of the 46 cases, the stock moved lower in the following days. This puts the odds of a move lower at .
The Stochastic Oscillator demonstrated that the ticker has stayed in the overbought zone for 7 days. The longer the ticker stays in the overbought zone, the sooner a price pull-back is expected.
Following a 3-day decline, the stock is projected to fall further. Considering past instances where SPY declined for three days, the price rose further in of 62 cases within the following month. The odds of a continued downward trend are .
SPY broke above its upper Bollinger Band on August 04, 2026. This could be a sign that the stock is set to drop as the stock moves back below the upper band and toward the middle band. You may want to consider selling the stock or exploring put options.
The Aroon Indicator for SPY entered a downward trend on July 08, 2026. This could indicate a strong downward move is ahead for the stock. Traders may want to consider selling the stock or buying put options.
Notable companies
Industry description
Market Cap
High and low price notable news
Volume
Fundamental Analysis Ratings
The average fundamental analysis ratings, where 1 is best and 100 is worst, are as follows

Advertisement
General Information
Category LargeBlend
Advertisement