


AI Trading Agents Generate Up to 82% Annualized Returns in Volatile Markets
Tickeron, a leading innovator in AI-driven financial technology, today announced the launch of its advanced AI Trading Agents. These cutting-edge brokerage agents deliver real-time trading signals powered by machine learning, leveraging tick-level brokerage data and precise trade amounts across 5-, 15-, and 60-minute timeframes. Designed to empower traders with superior insights, the agents have demonstrated exceptional performance, including annualized returns as high as 82%.
Press enter or click to view image in full size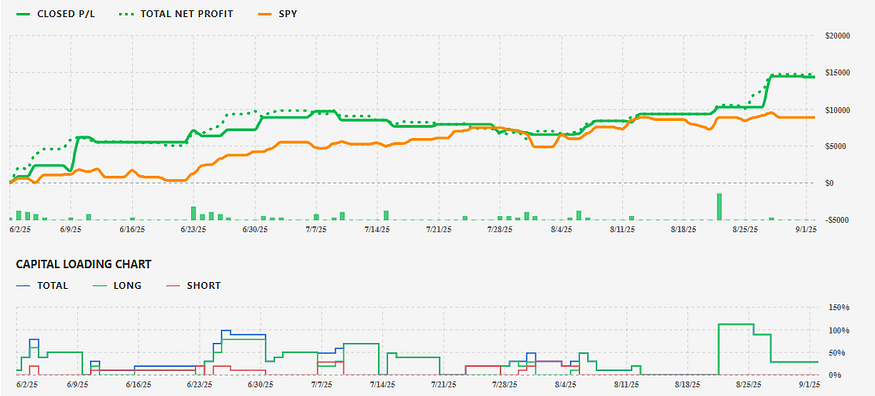
AAPL, GOOG, NVDA, TSLA, MSFT, SOXL, SOXS, QID, QLD — Trading…
Revolutionizing Trading with Financial Learning Models (FLMs)
At the heart of Tickeron’s AI Trading Agents are Financial Learning Models (FLMs), which seamlessly integrate artificial intelligence with technical analysis. Sergey Savastiouk, Ph.D., CEO of Tickeron, highlights the critical role of this approach in navigating market volatility: “In today’s fast-paced markets, technical analysis is essential for spotting patterns and making informed decisions. Our FLMs enhance this by providing traders with accurate, real-time insights, ensuring greater control and transparency.”
The agents analyze vast datasets to generate signals on high-liquidity stocks and ETFs, catering to both beginners and seasoned professionals. Beginner-friendly robots simplify the process, while specialized agents focus on volatile sectors, offering notifications for open and closed trades, pending orders, and customizable email alerts.
AI Trading for Stock Market | Tickeron
Outstanding Performance Metrics: MPWR AI Trading Agent
Tickeron’s MPWR AI Trading Agent, operating on a 5-minute timeframe, has delivered impressive results over 55 days. Starting with an initial balance of $100,000 and executing trades of $10,000 each, the agent achieved an annualized return of +82%. Closed trades generated a profit/loss of $9,772, showcasing its ability to capitalize on short-term opportunities in the semiconductor sector.
Users can access detailed stats, view trade histories, and follow the agent for real-time updates, making it an ideal tool for traders seeking high-growth strategies in dynamic markets.
Multi-Ticker Excellence: 9-Ticker AI Trading Agent
Expanding its capabilities, Tickeron’s AI Trading Agent for nine high-profile tickers — AAPL, GOOG, NVDA, TSLA, MSFT, SOXL, SOXS, QID, and QLD — operates on a 60-minute timeframe. Over 91 days, with an initial balance of $100,000 and $10,000 per trade, it posted an annualized return of +69% and a closed trades P/L of $14,362.
This diversified approach mitigates risk across technology, automotive, and leveraged ETFs, providing balanced exposure. Traders benefit from comprehensive views of open and closed trades, pending orders, and notification settings to stay ahead of market shifts.
AI Trading for Stock Market | Tickeron
Strong Returns in Private Equity: KKR AI Trading Agent
The KKR AI Trading Agent, also on a 5-minute timeframe, targets opportunities in private equity and alternative investments. With an initial balance of $100,000 and $10,000 trade amounts, it has realized an annualized return of +62% and a closed trades P/L of $8,841.
This agent exemplifies Tickeron’s commitment to specialized strategies, offering detailed descriptions, stats, and viewing options for users to monitor performance and adjust notifications accordingly.
Empowering Traders with AI Innovation
Tickeron’s AI Trading Agents represent a leap forward in brokerage technology, combining machine learning’s predictive power with granular tick-level data. By focusing on multiple timeframes, these agents enable precise entry and exit points, reducing emotional decision-making and enhancing profitability.
Dr. Savastiouk adds, “Our goal is to democratize advanced trading tools. Whether you’re a novice using our beginner robots or an expert leveraging high-liquidity strategies, Tickeron provides the transparency and real-time data needed to thrive.”
Available now, these agents include features like trade following, customizable notifications, and detailed analytics. For more information, visit Tickeron’s platform or contact the team.
AI Trading for Stock Market | Tickeron
About Tickeron
Tickeron is a pioneer in AI-powered financial tools, helping traders and investors make data-driven decisions through innovative models like FLMs. Committed to transparency and performance, Tickeron serves a global community of users seeking an edge in volatile markets.
Momentum Indicator for TSLA turns positive, indicating new upward trend
TSLA saw its Momentum Indicator move above the 0 level on September 11, 2025. This is an indication that the stock could be shifting in to a new upward move. Traders may want to consider buying the stock or buying call options. Tickeron's A.I.dvisor looked at 79 similar instances where the indicator turned positive. In of the 79 cases, the stock moved higher in the following days. The odds of a move higher are at .

Technical Analysis (Indicators)
Bullish Trend Analysis
The Moving Average Convergence Divergence (MACD) for TSLA just turned positive on September 05, 2025. Looking at past instances where TSLA's MACD turned positive, the stock continued to rise in of 44 cases over the following month. The odds of a continued upward trend are .
TSLA moved above its 50-day moving average on August 22, 2025 date and that indicates a change from a downward trend to an upward trend.
The 50-day moving average for TSLA moved above the 200-day moving average on September 16, 2025. This could be a long-term bullish signal for the stock as the stock shifts to an upward trend.
Following a 3-day Advance, the price is estimated to grow further. Considering data from situations where TSLA advanced for three days, in of 335 cases, the price rose further within the following month. The odds of a continued upward trend are .
The Aroon Indicator entered an Uptrend today. In of 277 cases where TSLA Aroon's Indicator entered an Uptrend, the price rose further within the following month. The odds of a continued Uptrend are .
Bearish Trend Analysis
The 10-day RSI Indicator for TSLA moved out of overbought territory on September 25, 2025. This could be a bearish sign for the stock. Traders may want to consider selling the stock or buying put options. Tickeron's A.I.dvisor looked at 34 similar instances where the indicator moved out of overbought territory. In of the 34 cases, the stock moved lower in the following days. This puts the odds of a move lower at .
The Stochastic Oscillator demonstrated that the ticker has stayed in the overbought zone for 10 days. The longer the ticker stays in the overbought zone, the sooner a price pull-back is expected.
Following a 3-day decline, the stock is projected to fall further. Considering past instances where TSLA declined for three days, the price rose further in of 62 cases within the following month. The odds of a continued downward trend are .
TSLA broke above its upper Bollinger Band on September 11, 2025. This could be a sign that the stock is set to drop as the stock moves back below the upper band and toward the middle band. You may want to consider selling the stock or exploring put options.
The Tickeron Price Growth Rating for this company is (best 1 - 100 worst), indicating outstanding price growth. TSLA’s price grows at a higher rate over the last 12 months as compared to S&P 500 index constituents.
The Tickeron PE Growth Rating for this company is (best 1 - 100 worst), pointing to outstanding earnings growth. The PE Growth rating is based on a comparative analysis of stock PE ratio increase over the last 12 months compared against S&P 500 index constituents.
The Tickeron Profit vs. Risk Rating rating for this company is (best 1 - 100 worst), indicating well-balanced risk and returns. The average Profit vs. Risk Rating rating for the industry is 83, placing this stock slightly better than average.
The Tickeron SMR rating for this company is (best 1 - 100 worst), indicating weak sales and an unprofitable business model. SMR (Sales, Margin, Return on Equity) rating is based on comparative analysis of weighted Sales, Income Margin and Return on Equity values compared against S&P 500 index constituents. The weighted SMR value is a proprietary formula developed by Tickeron and represents an overall profitability measure for a stock.
The Tickeron Valuation Rating of (best 1 - 100 worst) indicates that the company is significantly overvalued in the industry. This rating compares market capitalization estimated by our proprietary formula with the current market capitalization. This rating is based on the following metrics, as compared to industry averages: P/B Ratio (18.215) is normal, around the industry mean (4.157). P/E Ratio (252.018) is within average values for comparable stocks, (268.954). TSLA's Projected Growth (PEG Ratio) (7.494) is very high in comparison to the industry average of (1.855). TSLA has a moderately low Dividend Yield (0.000) as compared to the industry average of (0.045). P/S Ratio (16.051) is also within normal values, averaging (30.616).
Notable companies
Industry description
Market Cap
High and low price notable news
Volume
Fundamental Analysis Ratings
The average fundamental analysis ratings, where 1 is best and 100 is worst, are as follows


Advertisement
General Information
a manufacturer of electric sports cars
Industry MotorVehicles
Advertisement