


Analysis of GameStop (GME) Stock: News, AI Insights, and Market Trends. May 28, 2025
GameStop Corp. (NYSE: NYSE:GME) remains one of the most polarizing and closely watched stocks in the financial markets. Known for its meteoric rise during the 2021 meme stock frenzy, GME continues to capture the attention of retail and institutional investors alike. As of May 28, 2025, the stock’s volatility, driven by retail sentiment, technical patterns, and strategic corporate shifts, underscores its unique position in the market. This article, written from the perspective of a financial analyst, writer, and artificial intelligence specialist, delves into GME’s recent performance, leveraging data, statistics, and insights from Tickeron’s AI-driven tools, while highlighting the most popular market-moving news as of May 28, 2025.GME’s Recent Performance: A Statistical Overview
As of May 13, 2025, GameStop’s stock was trading at $28.40, reflecting a 1.25% increase (+$ 0.35) from the previous session, with a market capitalization of $3.8 billion. Over the past year, GME has shown resilience with a 56.44% increase, despite a year-to-date decline of -13.10%. The stock’s volatility remains a hallmark, with a 52-week range between $9.95 and $64.83, highlighting its susceptibility to sharp price swings driven by retail sentiment and market dynamics.
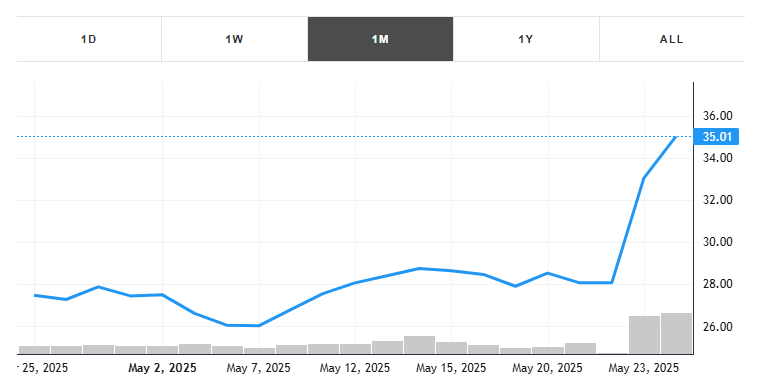
This month, the stock gained +27.49% with an average daily volume of 9 million shares traded. The stock tracked a drawdown of -9.47% for this period. GME showed earnings on March 25, 2025.
Key technical indicators provide further insight into GME’s trajectory:
- Moving Average Convergence Divergence (MACD): On May 13, 2025, the MACD turned positive, with historical data indicating a continued upward trend in 49 out of 49 cases over the following month.
- Momentum Indicator: The Momentum Indicator moved above the 0 level on May 9, 2025, with an upward trend observed in 85 past instances, suggesting strong bullish momentum.
- Moving Averages: The 10-day moving average crossed bullishly above the 50-day moving average on April 16, 2025, and the 50-day moving average crossed above the 200-day moving average on May 9, 2025, both signaling potential buy opportunities.
- Aroon Indicator: On May 13, 2025, the Aroon Indicator entered an uptrend, with a price increase observed in 169 prior instances, reinforcing bullish sentiment.
Despite these bullish signals, the Stochastic Oscillator suggests a potential shift from an upward to a downward trend, indicating caution for traders. These metrics, combined with high trading volume—approximately 55-58% of which occurs off-exchange—underscore GME’s liquidity and speculative nature.
AI-Driven Insights: Powering GME Analysis
Tickeron, a leader in AI-driven financial analysis under CEO Sergey Savastiouk, has revolutionized how traders approach volatile stocks like GME. Through its Financial Learning Models (FLMs), Tickeron integrates advanced technical analysis with machine learning to identify market patterns with precision. On May 11, 2025, Tickeron’s AI Pattern Search Engine detected a Broadening Top (Bullish) pattern for GME, signaling a potential breakout above the $28.05 entry price with a projected 6% upside to $29.73, albeit with a 22% confidence level. This pattern reflects heightened market indecision, often driven by large investors accumulating or distributing shares, with a breakout suggesting significant upward momentum.
Tickeron’s AI Trading Bots and Double Agents further enhance GME’s trading strategies. These tools provide real-time bullish and bearish signals, enabling traders to balance risk and reward. For instance, Tickeron’s high-liquidity stock robots ensure efficient trade execution, while user-friendly bots cater to novice traders navigating GME’s volatility. By incorporating sentiment analysis from platforms like X, Tickeron’s AI offers a holistic view of market dynamics, making it a valuable resource for traders seeking data-driven decisions.
Popular Market-Moving News for GME as of May 28, 2025Bullish Breakout Signals
On May 11, 2025, AI identified a bullish Broadening Top pattern for GME, fueling optimism among retail investors. The stock’s price action, trading at $28.40 as of May 13, 2025, aligned with bullish technical signals and strong retail sentiment on X, where posts highlighted GME’s potential for explosive moves above the $28 supply zone. The stock closed at $28.73 on May 14, 2025, with 58% of the 14 million share volume traded off-exchange, suggesting significant institutional activity
Retail investor enthusiasm remains a driving force for GME. Posts on X, such as those from @JRoland_ and @ACInvestorBlog, emphasized bullish chart patterns, including a large bull flag formation and positive momentum indicators. Additionally, @Ryan__Rigg noted strong positive sentiment, insider buying, and significant cash reserves, with bullish option flow building into May and June 2025 expiration dates. However, these posts should be treated as inconclusive, as they reflect sentiment rather than verified data.
Corporate Strategy and Volatility
GameStop’s strategic shifts, including its investment in Bitcoin and store closures, continue to influence its stock performance. While these moves aim to modernize the company, they contribute to its volatility, with mixed analyst sentiment tempering bullish expectations. The company’s focus on digital transformation and e-commerce, coupled with its cash reserves, positions it for potential long-term growth, but short-term price action remains speculative.
Trading Robots and GME: A Strategic Fit
AI Trading Agents are particularly well-suited for trading GME due to its volatility. Designed for both beginners and experienced traders, these bots leverage technical analysis to confirm market trends before executing trades, reducing the risk of false signals. For risk-averse investors, AI Agents analyze market conditions extensively, ensuring higher confidence in trade decisions. This approach aligns with GME’s unpredictable price movements, where rapid shifts in sentiment can lead to significant gains or losses.
Risks and Considerations for GME Investors
Despite bullish signals, GME’s volatility poses significant risks. The stock’s 22% confidence level for the projected $29.73 target indicates uncertainty, and the potential shift in the Stochastic Oscillator suggests a possible reversal. Additionally, mixed analyst sentiment and the company’s ongoing strategic overhaul introduce fundamental risks. Retail investors, while influential, may amplify volatility through speculative trading, as evidenced by high off-exchange volume. Traders should approach GME with caution, leveraging AI tools like those offered by Tickeron to navigate its unpredictable nature.
Conclusion: Navigating GME’s Future with AI and Data
GameStop (GME) remains a dynamic and volatile stock, driven by retail sentiment, technical patterns, and corporate strategy. As of May 28, 2025, bullish indicators such as the MACD, Momentum Indicator, and Aroon Uptrend suggest potential upside, with Tickeron’s AI identifying a breakout opportunity above $28.05. However, risks persist due to mixed analyst sentiment and speculative trading. AI-driven tools, including their Financial Learning Models and Trading Robots, provide traders with the precision and transparency needed to navigate GME’s volatility.
GME in downward trend: price may drop because broke its higher Bollinger Band on September 02, 2025
GME broke above its upper Bollinger Band on September 02, 2025. This could be a sign that the stock is set to drop as the stock moves back below the upper band and toward the middle band. You may want to consider selling the stock or exploring put options. The A.I.dvisor looked at 43 similar instances where the stock broke above the upper band. In of the 43 cases the stock fell afterwards. This puts the odds of success at .

Technical Analysis (Indicators)
Bearish Trend Analysis
GME moved below its 50-day moving average on September 03, 2025 date and that indicates a change from an upward trend to a downward trend.
Following a 3-day decline, the stock is projected to fall further. Considering past instances where GME declined for three days, the price rose further in of 62 cases within the following month. The odds of a continued downward trend are .
Bullish Trend Analysis
The RSI Oscillator points to a transition from a downward trend to an upward trend -- in cases where GME's RSI Indicator exited the oversold zone, of 29 resulted in an increase in price. Tickeron's analysis proposes that the odds of a continued upward trend are .
The Stochastic Oscillator is in the oversold zone. Keep an eye out for a move up in the foreseeable future.
The Momentum Indicator moved above the 0 level on September 05, 2025. You may want to consider a long position or call options on GME as a result. In of 88 past instances where the momentum indicator moved above 0, the stock continued to climb. The odds of a continued upward trend are .
The Moving Average Convergence Divergence (MACD) for GME just turned positive on August 05, 2025. Looking at past instances where GME's MACD turned positive, the stock continued to rise in of 49 cases over the following month. The odds of a continued upward trend are .
Following a 3-day Advance, the price is estimated to grow further. Considering data from situations where GME advanced for three days, in of 259 cases, the price rose further within the following month. The odds of a continued upward trend are .
The Aroon Indicator entered an Uptrend today. In of 146 cases where GME Aroon's Indicator entered an Uptrend, the price rose further within the following month. The odds of a continued Uptrend are .
The Tickeron Price Growth Rating for this company is (best 1 - 100 worst), indicating fairly steady price growth. GME’s price grows at a lower rate over the last 12 months as compared to S&P 500 index constituents.
The Tickeron Profit vs. Risk Rating rating for this company is (best 1 - 100 worst), indicating that the returns do not compensate for the risks. GME’s unstable profits reported over time resulted in significant Drawdowns within these last five years. A stable profit reduces stock drawdown and volatility. The average Profit vs. Risk Rating rating for the industry is 82, placing this stock better than average.
The Tickeron SMR rating for this company is (best 1 - 100 worst), indicating weak sales and an unprofitable business model. SMR (Sales, Margin, Return on Equity) rating is based on comparative analysis of weighted Sales, Income Margin and Return on Equity values compared against S&P 500 index constituents. The weighted SMR value is a proprietary formula developed by Tickeron and represents an overall profitability measure for a stock.
The Tickeron Valuation Rating of (best 1 - 100 worst) indicates that the company is significantly overvalued in the industry. This rating compares market capitalization estimated by our proprietary formula with the current market capitalization. This rating is based on the following metrics, as compared to industry averages: P/B Ratio (2.028) is normal, around the industry mean (7.700). P/E Ratio (42.660) is within average values for comparable stocks, (46.682). GME's Projected Growth (PEG Ratio) (0.000) is slightly lower than the industry average of (1.450). GME has a moderately low Dividend Yield (0.000) as compared to the industry average of (0.027). P/S Ratio (2.725) is also within normal values, averaging (3.592).
The Tickeron PE Growth Rating for this company is (best 1 - 100 worst), pointing to worse than average earnings growth. The PE Growth rating is based on a comparative analysis of stock PE ratio increase over the last 12 months compared against S&P 500 index constituents.
Notable companies
Industry description
Market Cap
High and low price notable news
Volume
Fundamental Analysis Ratings
The average fundamental analysis ratings, where 1 is best and 100 is worst, are as follows


Advertisement
General Information
a retaier of video game products and PC entertainment software
Industry SpecialtyStores
Advertisement