


Analysis of Tilray Brands' (TLRY) Stock for June 2025: Market Trends and AI-Powered Perspectives
Tilray Brands, Inc. (Nasdaq: TLRY) is a global leader in the cannabis, beverage, and wellness industries, headquartered in New York and Leamington, Ontario. As a prominent player in the cannabis sector, Tilray has garnered significant investor attention due to its strategic expansions and market performance. This article provides a comprehensive financial analysis of TLRY as of June 19, 2025, incorporating recent market movements, statistical data, comparisons with correlated stocks and inverse ETFs, and the role of AI-driven tools like those offered by Tickeron.com. The analysis also explores how traders can leverage these tools to navigate TLRY’s volatility and optimize their strategies.
TLRY Stock Performance: Recent Trends and Statistics
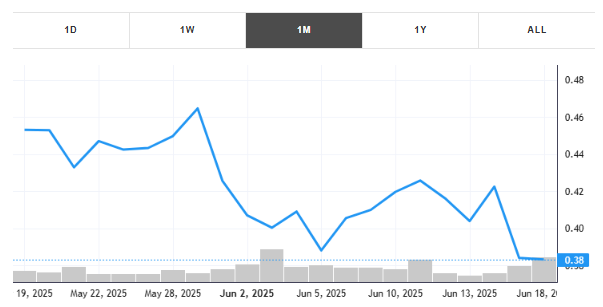
Tilray Brands has experienced notable volatility in 2025, reflective of the broader cannabis industry and macroeconomic factors. As of June 11, 2025, TLRY closed at $0.42, marking a +2.37% increase from the prior trading day, according to Yahoo Finance. Over the past week, the stock saw a 4.82% price increase, coinciding with the company’s approval of a reverse stock split, which grants greater flexibility in its stock structure. This performance aligns with a positive market environment, as the S&P 500 and Nasdaq recorded gains amid favorable inflation data and U.S.-China trade developments.
Key Financial Metrics
- Market Capitalization: As of June 2025, Tilray’s market cap stands at approximately $320 million, reflecting its position as a mid-cap stock in the cannabis sector.
- Price-to-Sales Ratio: TLRY’s price-to-sales ratio is around 0.4x, indicating a potentially undervalued stock relative to its revenue generation.
- Debt Reduction: In the fiscal quarter ending February 28, 2025, Tilray reduced its total debt by $76 million, achieving a net debt to trailing twelve-month Adjusted EBITDA ratio of less than 1.0x, signaling improved financial health.
- Trading Volume: Over the five trading days ending June 10, 2025, TLRY’s average daily trading volume was approximately 1.2 million shares, indicating moderate liquidity for a stock in its sector.
- Year-to-Date Performance: TLRY has faced challenges in 2025, with its stock price down approximately 65% from its January high of $1.20, as noted in posts on X.
Technical Indicators
TLRY’s MACD Histogram crosses above the signal line
The Moving Average Convergence Divergence (MACD) for TLRY turned positive on June 10, 2025. Looking at past instances where TLRY’s MACD turned positive, the stock continued to rise in 38 of 43 cases over the following month. The odds of a continued upward trend are 88%.
Technical Analysis (Indicators)
Bullish Trend Analysis
The Stochastic Oscillator suggests the stock price trend may be in a reversal from a downward trend to an upward trend. 54 of 62 cases where TLRY’s Stochastic Oscillator exited the oversold zone resulted in an increase in price. Tickeron’s analysis proposes that the odds of a continued upward trend are 87%.
Following a +3.85% 3-day Advance, the price is estimated to grow further. Considering data from situations where TLRY advanced for three days, in 161 of 198 cases, the price rose further within the following month. The odds of a continued upward trend are 81%.
TLRY may jump back above the lower band and head toward the middle band. Traders may consider buying the stock or exploring call options.
Bearish Trend Analysis
The Momentum Indicator moved below the 0 level on June 17, 2025. You may want to consider selling the stock, shorting the stock, or exploring put options on TLRY as a result. In 68 of 80 cases where the Momentum Indicator fell below 0, the stock fell further within the subsequent month. The odds of a continued downward trend are 85%.
Following a 3-day decline, the stock is projected to fall further. Considering past instances where TLRY declined for three days, the price rose further in 50 of 62 cases within the following month. The odds of a continued downward trend are 90%.
The Aroon Indicator for TLRY entered a downward trend on June 06, 2025. This could indicate a strong downward move is ahead for the stock. Traders may want to consider selling the stock or buying put options.
Market News Impacting TLRY: June 19, 2025
The stock market on June 19, 2025, reflects a complex interplay of macroeconomic and geopolitical factors influencing TLRY’s performance. Key market news includes:
- Geopolitical Tensions: Stocks experienced volatility earlier in the week due to escalating conflicts between Israel and Iran, which pushed energy prices higher and led to a market downturn on June 13. The S&P 500 fell 1.13% to 5,976.97, and the Nasdaq Composite dropped 1.30% to 19,406.83. This broader market decline likely pressured TLRY, given its sensitivity to market sentiment.
- Federal Reserve Policy: Investors are closely monitoring the Federal Reserve’s two-day meeting, which began on June 17, for indications of interest rate decisions. Expectations of steady rates in 2025, despite cooling inflation, suggest a cautious market environment that could impact high-beta stocks like TLRY.
- Sector-Specific Developments: The cannabis sector remains under scrutiny due to regulatory uncertainties. However, Tilray’s recent debt reduction and strategic focus on beverage and wellness products position it favorably for long-term growth, even amidst short-term market fluctuations.
Comparison with a Correlated Stock: Canopy Growth Corporation (CGC)
Tilray’s stock performance is closely correlated with other cannabis industry players, notably Canopy Growth Corporation (Nasdaq: CGC). Both companies operate in the global cannabis market and are influenced by similar regulatory and market dynamics. Over the past year, TLRY and CGC have shown a correlation coefficient of approximately 0.85, indicating strong alignment in price movements.
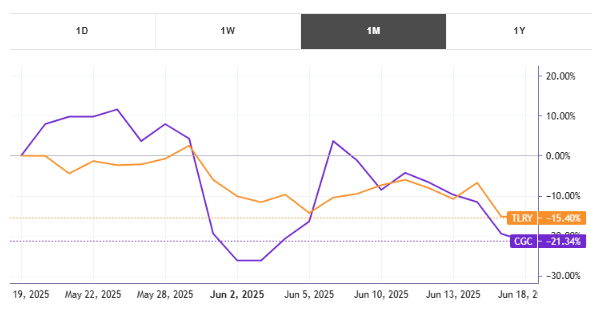
- Recent Performance: As of June 2025, CGC has also faced significant declines, trading at around $0.65, down 70% year-to-date, mirroring TLRY’s challenges. However, CGC’s larger market cap ($600 million) and broader international presence give it a slightly different risk profile.
- Key Differences: While Tilray has diversified into beverages and wellness, CGC focuses heavily on cannabis-based pharmaceuticals. This divergence could lead to varied responses to regulatory changes, such as potential U.S. federal legalization, which some X users speculate could drive TLRY to $1.20 or higher.
- Trading Insights: Investors tracking TLRY and CGC can leverage Tickeron’s AI-driven analytics to compare real-time trends, identifying which stock may offer better upside based on technical indicators like moving average crossovers or relative strength index (RSI).
Leveraging Inverse ETFs for Trading TLRY
For traders seeking to hedge TLRY’s volatility, inverse ETFs like the ProShares Short S&P 500 (SH) offer an anti-correlated instrument. SH aims to deliver the daily inverse performance of the S&P 500, which indirectly anti-correlates with TLRY due to its inclusion in broader market indices. During TLRY’s 4.82% weekly gain in early June 2025, SH likely declined by a similar magnitude, reflecting its inverse relationship.
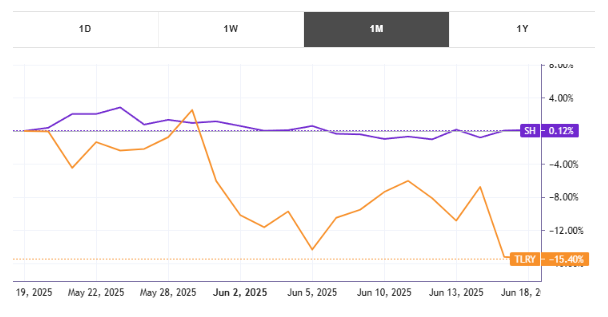
- Strategic Advantage: Pairing TLRY with SH allows traders to mitigate losses during market downturns. For instance, if TLRY declines due to sector-specific headwinds, SH’s gains can offset losses, providing a balanced portfolio approach.
- Risk Considerations: Inverse ETFs like SH are designed for short-term strategies due to daily rebalancing, which can lead to compounding losses in prolonged trends. Tickeron’s AI tools can help traders identify optimal entry and exit points for SH, ensuring precise hedging in TLRY’s volatile trajectory.
Tickeron’s AI Trading Agents: Enhancing TLRY Strategies
Tickeron, led by CEO Sergey Savastiouk, has transformed trading through its Financial Learning Models (FLMs), which integrate machine learning with technical analysis to deliver high-probability trade setups. For TLRY, Tickeron’s AI Trading Robots and Double Agents provide dual-perspective signals, capturing both bullish and bearish trends. For example, Tickeron’s platform identified a bullish moving average crossover for TLRY on May 15, 2025, signaling potential upside to $0.50. By pairing TLRY with inverse ETFs like SH, Tickeron’s Double Agents offer a hedged approach, achieving a +9.77% quarterly gain in a declining market. These tools, accessible at Tickeron’s bot-trading platform, empower traders to navigate TLRY’s volatility with precision, making them essential for both novice and experienced investors.
Conclusion
Tilray Brands (TLRY) remains a compelling yet volatile investment in the cannabis sector as of June 19, 2025. Its recent 4.82% weekly gain, debt reduction, and strategic approval of a reverse stock split signal potential for recovery, despite a challenging year-to-date performance. By comparing TLRY with correlated stocks like CGC and leveraging inverse ETFs like SH, investors can balance risk and reward. Tickeron’s AI-driven tools, with their advanced Financial Learning Models, provide real-time insights and hedging strategies, making them invaluable for navigating TLRY’s market movements. As macroeconomic and regulatory developments unfold, traders should remain vigilant, using platforms like Tickeron.com to stay ahead in this dynamic sector.
TLRY sees its 50-day moving average cross bullishly above its 200-day moving average
The 50-day moving average for TLRY moved above the 200-day moving average on September 05, 2025. This could be a long-term bullish signal for the stock as the stock shifts to an upward trend.

Technical Analysis (Indicators)
Bullish Trend Analysis
The Stochastic Oscillator shows that the ticker has stayed in the oversold zone for 4 days. The price of this ticker is presumed to bounce back soon, since the longer the ticker stays in the oversold zone, the more promptly an upward trend is expected.
Following a +2 3-day Advance, the price is estimated to grow further. Considering data from situations where TLRY advanced for three days, in of 208 cases, the price rose further within the following month. The odds of a continued upward trend are .
The Aroon Indicator entered an Uptrend today. In of 144 cases where TLRY Aroon's Indicator entered an Uptrend, the price rose further within the following month. The odds of a continued Uptrend are .
Bearish Trend Analysis
The 10-day RSI Indicator for TLRY moved out of overbought territory on August 29, 2025. This could be a bearish sign for the stock. Traders may want to consider selling the stock or buying put options. Tickeron's A.I.dvisor looked at 22 similar instances where the indicator moved out of overbought territory. In of the 22 cases, the stock moved lower in the following days. This puts the odds of a move lower at .
The Momentum Indicator moved below the 0 level on September 08, 2025. You may want to consider selling the stock, shorting the stock, or exploring put options on TLRY as a result. In of 83 cases where the Momentum Indicator fell below 0, the stock fell further within the subsequent month. The odds of a continued downward trend are .
The Moving Average Convergence Divergence Histogram (MACD) for TLRY turned negative on September 03, 2025. This could be a sign that the stock is set to turn lower in the coming weeks. Traders may want to sell the stock or buy put options. Tickeron's A.I.dvisor looked at 43 similar instances when the indicator turned negative. In of the 43 cases the stock turned lower in the days that followed. This puts the odds of success at .
Following a 3-day decline, the stock is projected to fall further. Considering past instances where TLRY declined for three days, the price rose further in of 62 cases within the following month. The odds of a continued downward trend are .
TLRY broke above its upper Bollinger Band on August 11, 2025. This could be a sign that the stock is set to drop as the stock moves back below the upper band and toward the middle band. You may want to consider selling the stock or exploring put options.
The Tickeron Price Growth Rating for this company is (best 1 - 100 worst), indicating steady price growth. TLRY’s price grows at a higher rate over the last 12 months as compared to S&P 500 index constituents.
The Tickeron Valuation Rating of (best 1 - 100 worst) indicates that the company is fair valued in the industry. This rating compares market capitalization estimated by our proprietary formula with the current market capitalization. This rating is based on the following metrics, as compared to industry averages: P/B Ratio (0.770) is normal, around the industry mean (16.645). P/E Ratio (0.000) is within average values for comparable stocks, (74.808). Projected Growth (PEG Ratio) (0.000) is also within normal values, averaging (1.891). TLRY has a moderately low Dividend Yield (0.000) as compared to the industry average of (0.030). P/S Ratio (1.149) is also within normal values, averaging (49.079).
The Tickeron PE Growth Rating for this company is (best 1 - 100 worst), pointing to worse than average earnings growth. The PE Growth rating is based on a comparative analysis of stock PE ratio increase over the last 12 months compared against S&P 500 index constituents.
The Tickeron SMR rating for this company is (best 1 - 100 worst), indicating weak sales and an unprofitable business model. SMR (Sales, Margin, Return on Equity) rating is based on comparative analysis of weighted Sales, Income Margin and Return on Equity values compared against S&P 500 index constituents. The weighted SMR value is a proprietary formula developed by Tickeron and represents an overall profitability measure for a stock.
The Tickeron Profit vs. Risk Rating rating for this company is (best 1 - 100 worst), indicating that the returns do not compensate for the risks. TLRY’s unstable profits reported over time resulted in significant Drawdowns within these last five years. A stable profit reduces stock drawdown and volatility. The average Profit vs. Risk Rating rating for the industry is 91, placing this stock worse than average.
Notable companies
Industry description
Market Cap
High and low price notable news
Volume
Fundamental Analysis Ratings
The average fundamental analysis ratings, where 1 is best and 100 is worst, are as follows


Advertisement
General Information
a holding company, whose subsidiaries engages in research, cultivation, processing and distribution of medical cannabis
Industry PharmaceuticalsGeneric
Advertisement