


Review of the Week of July 7–11, 2025: Financial Leaders
Trade Tensions Dominate: President Trump's tariff deadline of August 1 created significant market volatility, with futures initially declining as investors prepared for potential tariff reimposition on countries without trade deals.
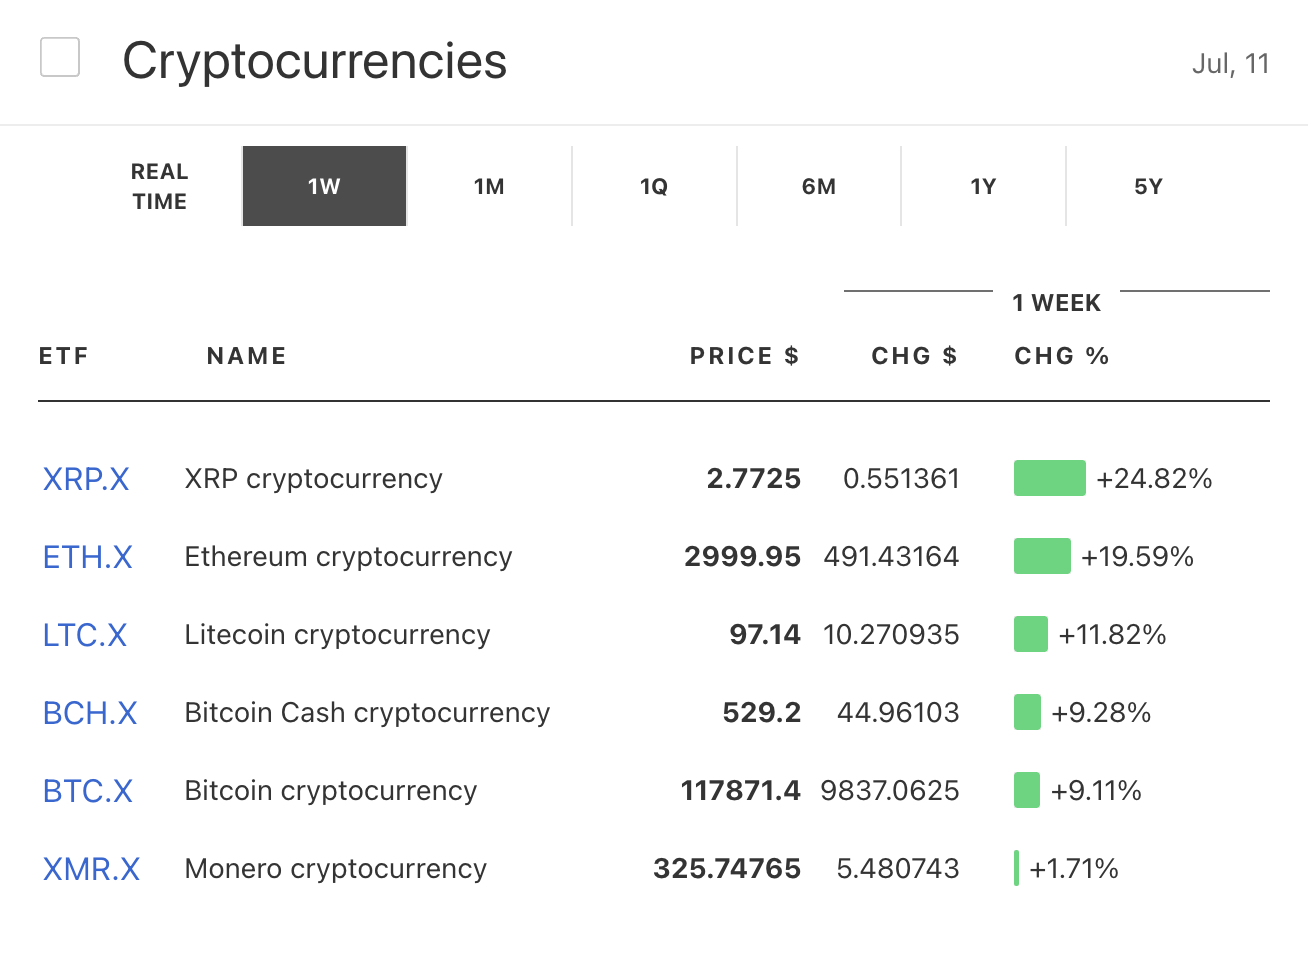
Historic Milestones: Nvidia (NVDA) became the first company to reach a $4 trillion market cap, while Bitcoin (BTC.X) smashed through $112,000 to set new all-time highs.
Currency Volatility: The Japanese yen plummeted 1.5% against the dollar after Japan failed to secure a trade deal, while Sterling declined on weak UK economic data.
Market Resilience: Despite initial tariff concerns, tech stocks staged a remarkable comeback with the Nasdaq (QQQ) reaching new record highs driven by AI optimism.
Political Upheaval: Tesla (TSLA) crashed 6.8% after Elon Musk announced formation of his "America Party," creating friction with former ally Donald Trump.
Overview
The week of July 7-11, 2025, witnessed extraordinary market dynamics as investors navigated between escalating trade tensions and breakthrough technological milestones. The period began with significant selling pressure as Trump's tariff deadline approached, but concluded with historic achievements in both equity and cryptocurrency markets. The week highlighted the market's ability to digest geopolitical uncertainty while simultaneously celebrating technological innovation, creating a complex environment where traditional risk-off sentiment competed with growth-driven optimism.
Financial Markets Weekly Recap
Equities
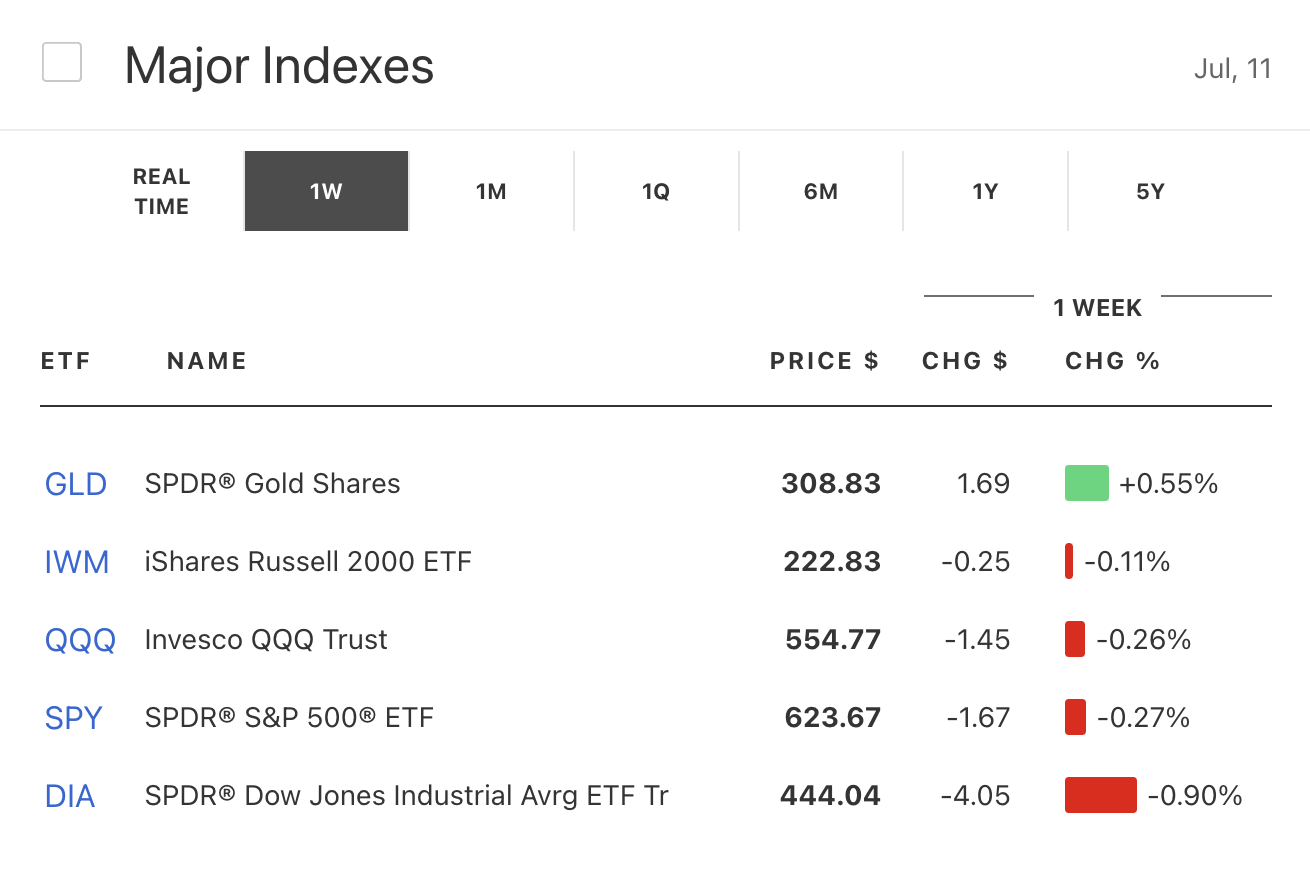
Market Indices: The S&P 500 (SPY) initially declined 0.3% on Monday as traders returned from the July 4th holiday to fresh tariff tensions. However, the index finished the week near record highs despite pulling back on Friday due to renewed trade concerns. The Nasdaq (QQQ) demonstrated remarkable resilience, rebounding 0.5% on Tuesday as tech-loving dip buyers emerged, ultimately soaring to new record highs of 20,611.34 by Wednesday. The Dow futures fell approximately 113 points on Monday morning but recovered throughout the week.
Sector Performance: Technology stocks dominated the week's performance, with artificial intelligence companies leading the charge. Energy and defense sectors experienced volatility due to geopolitical tensions, while financial services showed mixed results amid interest rate uncertainty.
Corporate Highlights:
Nvidia (NVDA): The AI chip giant achieved a historic milestone by becoming the first company to reach a $4 trillion market cap during Wednesday's trading session. Shares jumped 1.1% on Tuesday to close at $160.01, putting the company within striking distance of the unprecedented valuation. The stock hit an all-time session high of $164.42 before closing at $162.88, valuing the company at $3.97 trillion. The achievement came just as the company approaches its August 27 earnings report, with analysts expecting $45.6 billion in sales.
Tesla (TSLA): Shares plummeted 6.8% on Monday, erasing close to $70 billion in market value as investors reacted negatively to Elon Musk's announcement of forming the "America Party". The political venture, targeting "2 or 3 Senate seats and 8 to 10 House districts," deepened investor concerns about CEO distractions. Trump responded by calling Musk a "train wreck" and describing the billionaire as having gone "completely off the rails". The stock attempted to recover some losses during the week's tech rally but remained under pressure from the political controversy.
GameSquare (GAME): The small-cap media and technology company experienced explosive growth, with shares skyrocketing over 150% after announcing a treasury strategy to purchase up to $100 million worth of Ethereum. The company raised $8 million through an underwritten public offering to fund its cryptocurrency accumulation strategy. The stock reached a high of $2.66 before settling at $2.16.
Currencies
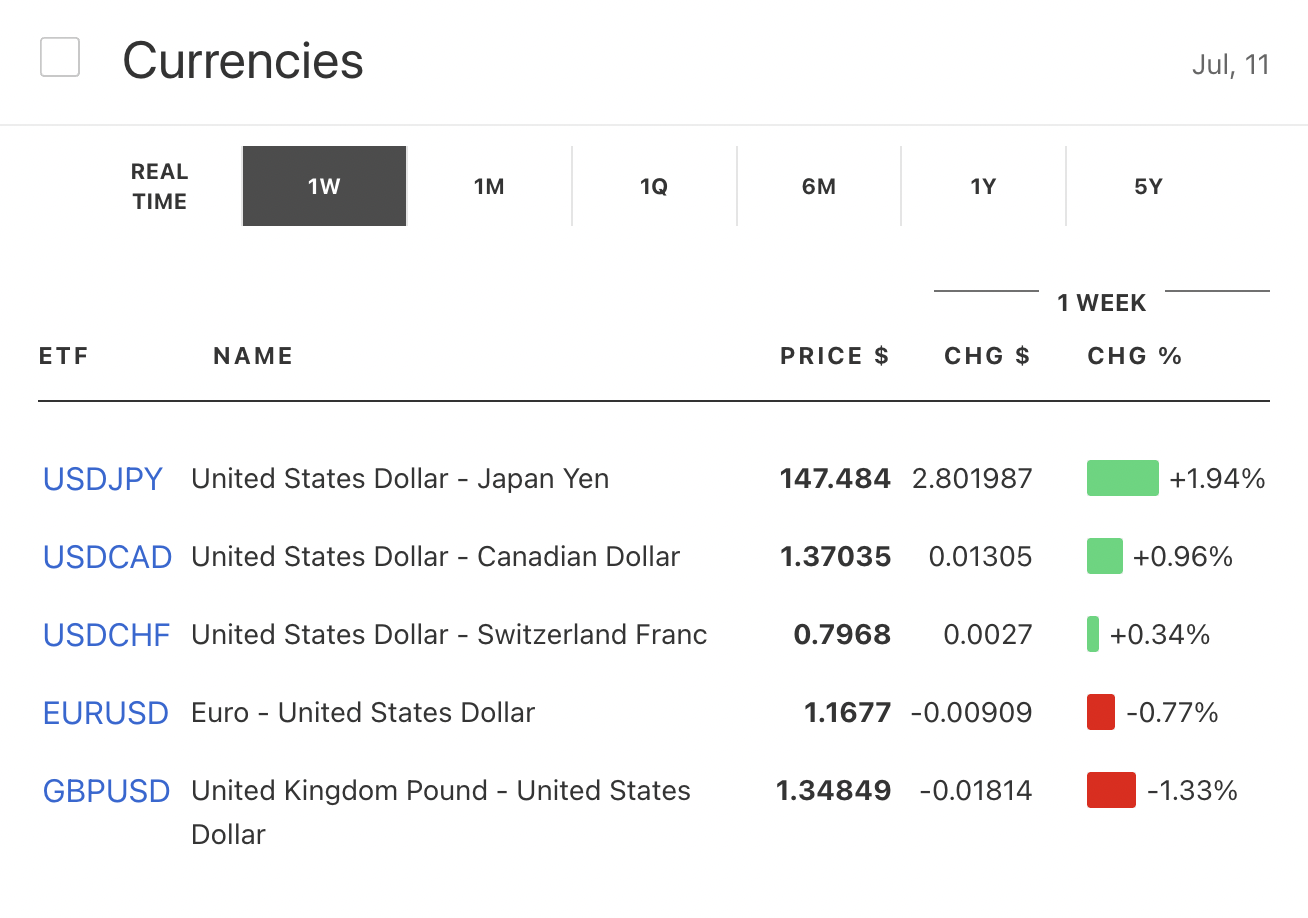
US Dollar: The dollar index demonstrated significant strength throughout the week, rising on safe-haven demand amid tariff uncertainty. The greenback gained across the board as traders prepared for potential trade disruptions.
USD/JPY: The yen experienced a dramatic selloff, falling 1.5% in less than two days after President Trump confirmed Japan failed to secure a trade deal before the deadline. The pair ripped through the ¥146.00 mark to hit ¥146.50 as the 25% tariff rate was set to take effect August 1. Japanese officials were reportedly blindsided by Trump's announcement on social media.
GBP/USD: Sterling declined 1.5% from the previous week's three-year high, falling to near $1.36 as dollar strength dominated. The pound faced additional pressure on Friday after UK GDP data showed an unexpected 0.1% contraction in May, marking the second consecutive month of decline. The currency traded dangerously close to its 50-day simple moving average at $1.3493.
EUR/USD: The euro experienced volatility throughout the week as investors awaited potential tariff announcements affecting the European Union. The currency faced pressure from both dollar strength and uncertainty about trade negotiations.
Commodities
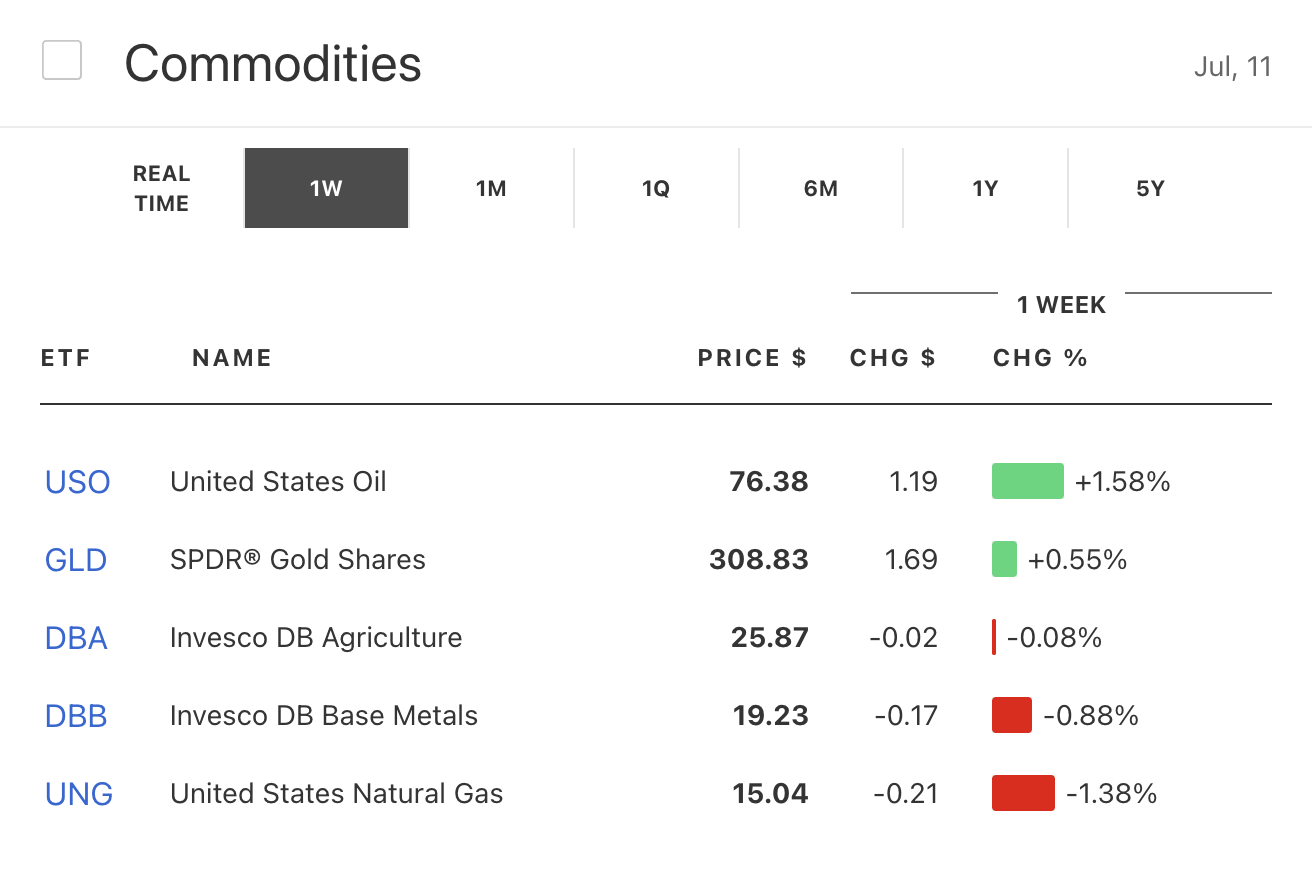
Gold (GLD): Gold prices dipped to a one-week low under $3,300 as the dollar strengthened and investors rotated out of safe-haven assets. The precious metal traded near $3,280 early Wednesday, down 0.5% on the day, marking its third straight daily loss. The 10-year Treasury yield reaching three-week peaks contributed to gold's decline.
Oil: Crude oil prices showed mixed performance throughout the week, with volatility driven by geopolitical tensions and supply concerns. The commodity faced pressure from potential demand destruction due to tariff-induced economic slowdown concerns.
Cryptocurrencies
Bitcoin (BTC.X): The flagship cryptocurrency delivered spectacular performance, initially trading near $109,000 on Monday before exploding to new all-time highs. By Wednesday, Bitcoin blasted through $112,000, eclipsing its previous record of $111,900. The momentum continued, with the crypto powering from $112,000 to as high as $118,000 in less than 24 hours. Bitcoin's market cap surpassed $2.3 trillion, with traders eyeing the psychological $120,000 milestone. The rally was driven by institutional inflows, ETF buying, and risk-on sentiment spilling over from record stock markets.
Ethereum (ETH.X): Ethereum climbed back toward $2,800, popping 7% over two days as corporate adoption gained momentum. The second-largest cryptocurrency's rally was fueled by GameSquare's announcement of its $100 million treasury strategy focused on Ethereum rather than Bitcoin. The move highlighted growing corporate interest in alternative cryptocurrencies for treasury diversification.
Economic Indicators and Policy Developments
US Trade Policy: President Trump's administration issued final tariff notices to seven minor trading partners on Wednesday, while negotiations continued with major partners including the EU. The 90-day pause on reciprocal tariffs was set to expire, with countries facing tariff rates of 25% to 40% if no deals were reached. Only the UK and Vietnam had secured trade agreements by the deadline.
Federal Reserve Policy: The release of June FOMC meeting minutes on Wednesday revealed that only "a couple" of officials believed interest rates could be lowered as early as July. The majority of policymakers expressed concerns about inflationary pressures from tariffs and slower economic growth. Fed funds futures traders priced in only a 6.7% probability of a July cut, down from 23.8% the previous week.
UK Economic Data: The UK economy contracted by 0.1% in May, marking the second consecutive month of decline and missing analyst expectations for a mild rebound. The data increased speculation that the Bank of England might cut rates sooner than expected, with money markets pricing an 80% chance of a cut at the August meeting.
Geopolitical Developments
US-Japan Relations: The breakdown in trade negotiations between the US and Japan created significant market volatility, with the yen suffering its steepest decline in months. Japan's failure to secure a deal before the deadline meant facing a 25% tariff rate starting August 1.
US-Canada Trade Tensions: Trump announced plans to impose 35% tariffs on some Canadian goods, prompting Canada to threaten 25% retaliatory tariffs on $21 billion worth of American imports. The escalation highlighted the fragile nature of North American trade relationships.
European Union Negotiations: While the EU remained without a finalized trade agreement, ongoing negotiations suggested potential for last-minute deals to avoid severe tariff impositions.
Market Outlook
As markets head into the following week, several key developments will shape investor sentiment:
Tariff Implementation: The August 1 deadline for tariff reimposition remains the critical focal point, with markets watching for any extensions or last-minute trade deals. The severity of actually implemented tariffs will determine the extent of economic impact.
Earnings Season: With major corporate earnings approaching, including Nvidia's highly anticipated August 27 report, investors will scrutinize whether revenue growth can justify current elevated valuations.
Federal Reserve Policy: The July FOMC meeting will be closely watched for signals about future rate cuts, with markets currently pricing limited probability of immediate easing.
Cryptocurrency Momentum: Bitcoin's breakthrough above $112,000 has positioned the digital asset for potential further gains, with the psychological $120,000 level becoming the next key target.
Global Economic Data: Continued monitoring of economic indicators from major economies will provide insight into the real-world impact of trade tensions and monetary policy decisions.
NVDA's Stochastic Oscillator is staying in oversold zone for 6 days
The price of this ticker is presumed to bounce back soon, since the longer the ticker stays in the oversold zone, the more promptly an uptrend is expected.

Technical Analysis (Indicators)
Bullish Trend Analysis
Following a 3-day Advance, the price is estimated to grow further. Considering data from situations where NVDA advanced for three days, in of 363 cases, the price rose further within the following month. The odds of a continued upward trend are .
NVDA may jump back above the lower band and head toward the middle band. Traders may consider buying the stock or exploring call options.
Bearish Trend Analysis
The Momentum Indicator moved below the 0 level on June 23, 2026. You may want to consider selling the stock, shorting the stock, or exploring put options on NVDA as a result. In of 79 cases where the Momentum Indicator fell below 0, the stock fell further within the subsequent month. The odds of a continued downward trend are .
NVDA moved below its 50-day moving average on June 22, 2026 date and that indicates a change from an upward trend to a downward trend.
The 10-day moving average for NVDA crossed bearishly below the 50-day moving average on June 17, 2026. This indicates that the trend has shifted lower and could be considered a sell signal. In of 18 past instances when the 10-day crossed below the 50-day, the stock continued to move higher over the following month. The odds of a continued downward trend are .
Following a 3-day decline, the stock is projected to fall further. Considering past instances where NVDA declined for three days, the price rose further in of 62 cases within the following month. The odds of a continued downward trend are .
The Aroon Indicator for NVDA entered a downward trend on July 02, 2026. This could indicate a strong downward move is ahead for the stock. Traders may want to consider selling the stock or buying put options.
Fundamental Analysis (Ratings)
The Tickeron Profit vs. Risk Rating rating for this company is (best 1 - 100 worst), indicating low risk on high returns. The average Profit vs. Risk Rating rating for the industry is 65, placing this stock better than average.
The Tickeron SMR rating for this company is (best 1 - 100 worst), indicating very strong sales and a profitable business model. SMR (Sales, Margin, Return on Equity) rating is based on comparative analysis of weighted Sales, Income Margin and Return on Equity values compared against S&P 500 index constituents. The weighted SMR value is a proprietary formula developed by Tickeron and represents an overall profitability measure for a stock.
The Tickeron Price Growth Rating for this company is (best 1 - 100 worst), indicating fairly steady price growth. NVDA’s price grows at a lower rate over the last 12 months as compared to S&P 500 index constituents.
The Tickeron Valuation Rating of (best 1 - 100 worst) indicates that the company is slightly overvalued in the industry. This rating compares market capitalization estimated by our proprietary formula with the current market capitalization. This rating is based on the following metrics, as compared to industry averages: P/B Ratio (25.840) is normal, around the industry mean (21.518). P/E Ratio (31.953) is within average values for comparable stocks, (327.646). Projected Growth (PEG Ratio) (0.642) is also within normal values, averaging (2.056). NVDA has a moderately low Dividend Yield (0.001) as compared to the industry average of (0.013). P/S Ratio (20.121) is also within normal values, averaging (60.289).
The Tickeron PE Growth Rating for this company is (best 1 - 100 worst), pointing to worse than average earnings growth. The PE Growth rating is based on a comparative analysis of stock PE ratio increase over the last 12 months compared against S&P 500 index constituents.
Notable companies
Industry description
Market Cap
High and low price notable news
Volume
Fundamental Analysis Ratings
The average fundamental analysis ratings, where 1 is best and 100 is worst, are as follows

Advertisement
General Information
a manufacturer of computer graphics processors, chipsets, and related multimedia software
Industry Semiconductors
Advertisement