


The Power of Confirmation Stock Trading in AI-Driven Strategies
Confirmation trading is a time‑tested technique that waits for multiple indicators or patterns to “confirm” a trend before entering a position. By requiring several signals to align, confirmation trading helps filter out noise and improve trade reliability. In modern markets, Artificial Intelligence can automate and enhance these methods, rapidly scanning multi‑timeframe signals and adapting to changing conditions. Below, we explore classic confirmation techniques and how Tickeron’s AI harnesses them.
Tickeron trains its AI Trading Agents on decades of historical data, teaching them to recognize and act on confirmation patterns across markets and timeframes.
1. Moving‑Average Confirmation
a. Ex. Short‑Term Candlestick Averages (5/8/13)
- Setup: Plot three simple moving averages (SMAs)—5‑, 8‑, and 13‑period—on your chosen candlestick chart (e.g., 1 min, 5 min, 15 min, 1 h, 4 h, 1 day).
- Rule: Only enter a long trade when all three SMAs are sloping up and the price is trading above each. For shorts, all three SMAs must slope down with price below each.
- Benefit: Multiple short‑term SMAs reduce false breakouts; they confirm momentum across ultra‑short to short timeframes.
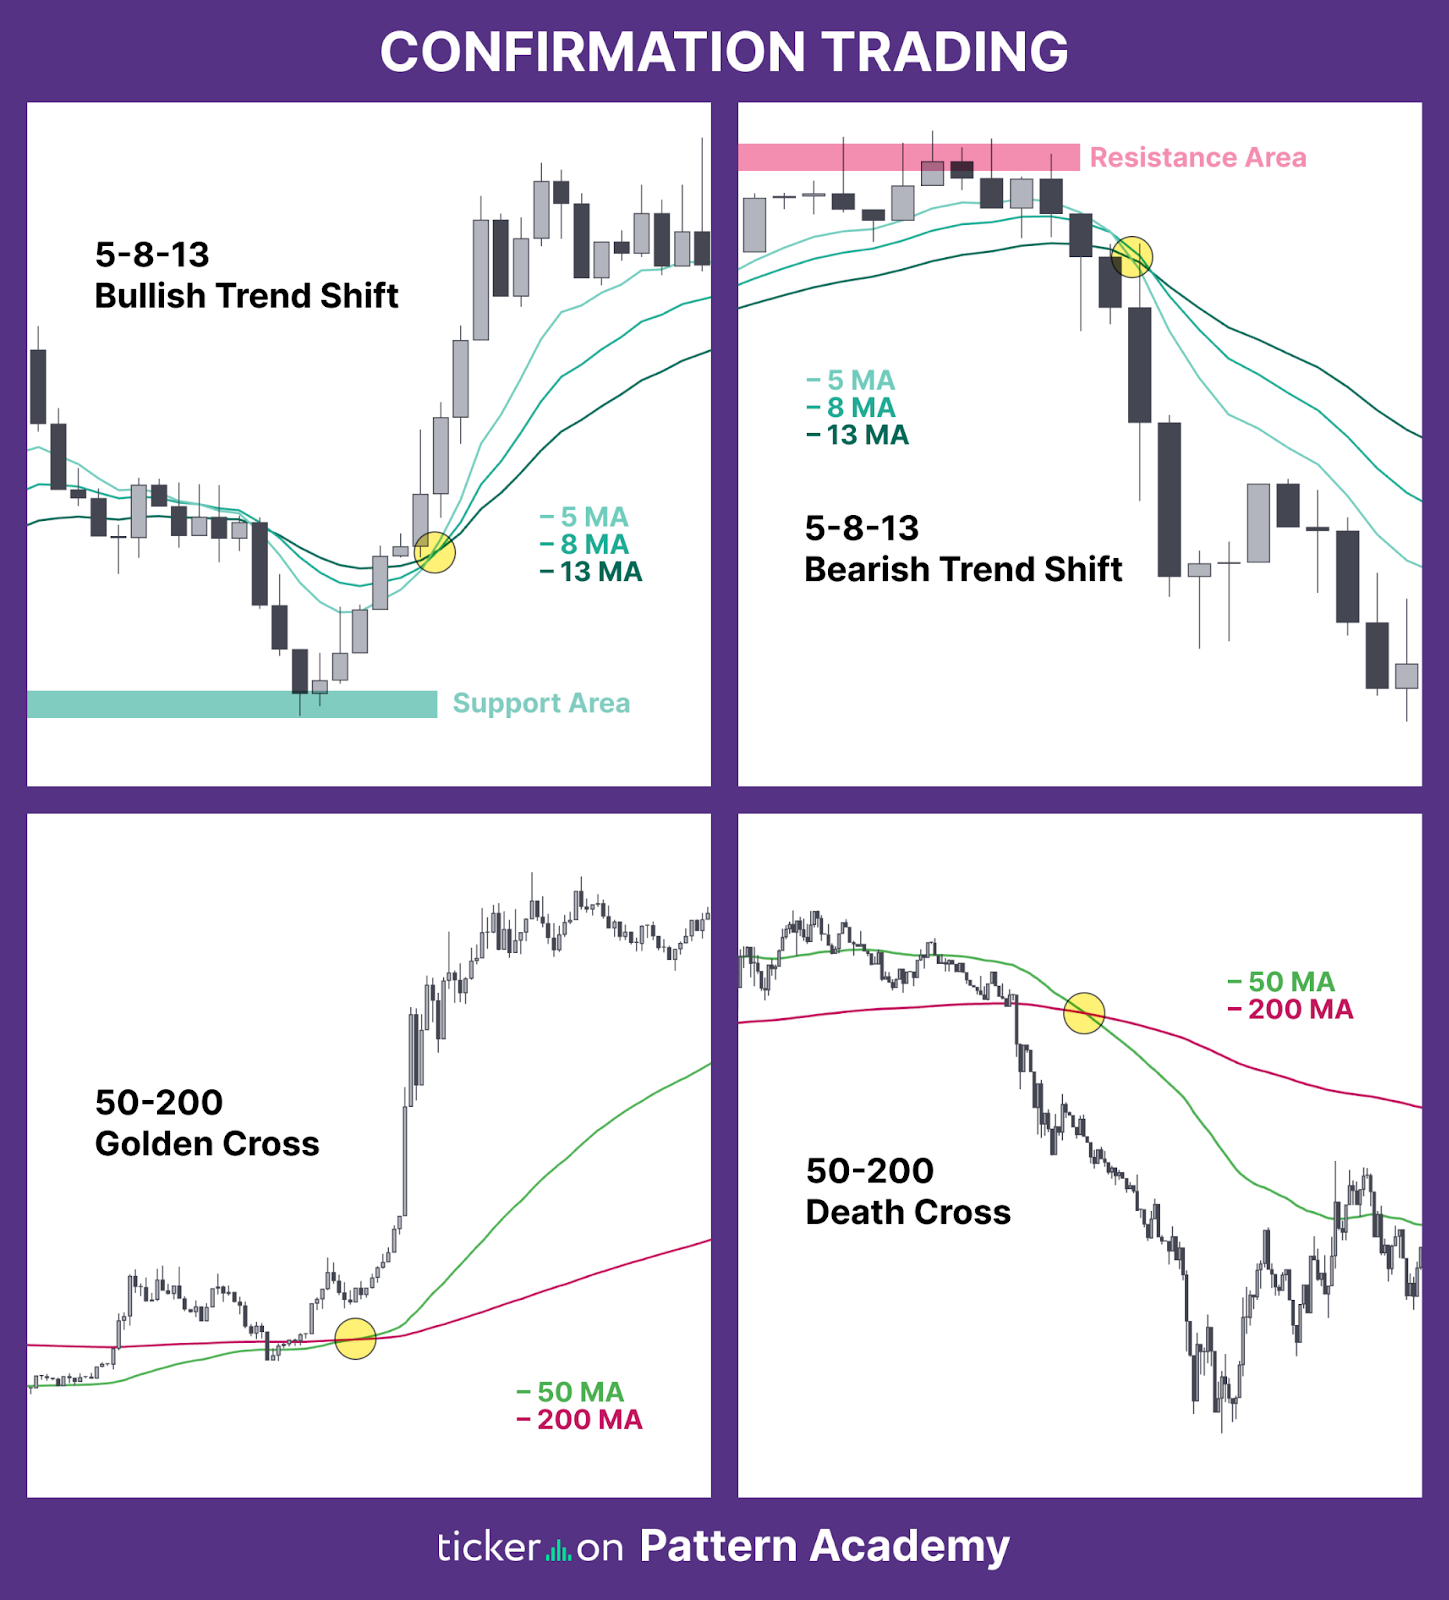
b. Ex. Longer‑Term Averages (50/200‑Day)
- Setup: On a daily chart, plot the 50‑ and 200‑day SMAs.
- Rule: A “golden cross” (50 > 200) confirms a bullish regime; a “death cross” (50 < 200) confirms bearish bias. Traders initiate new positions only in the direction of the cross.
- Benefit: Captures large‑scale trend shifts, ideal for swing and position traders.
2. Other Examples of Pattern‑Based Confirmation Techniques
- MACD Histogram Confirmation
- Signal: Wait for the MACD histogram to turn positive (or negative) and remain so for n bars (e.g., 3 consecutive bars) before entering.
- Why It Works: Confirms momentum shift and reduces whipsaws.
- Signal: Wait for the MACD histogram to turn positive (or negative) and remain so for n bars (e.g., 3 consecutive bars) before entering.
- RSI Break Confirmation
- Signal: After RSI crosses above 50 for a long (or below 50 for a short), wait for it to retest 50 and bounce in the same direction.
- Why It Works: Verifies that underlying strength (or weakness) is sustainable, not a fleeting spike.
- Signal: After RSI crosses above 50 for a long (or below 50 for a short), wait for it to retest 50 and bounce in the same direction.
- Trendline or Channel Break + Retest
- Signal: Draw a trendline across at least two swing highs (for shorts) or lows (for longs). Enter only after price breaks the trendline and then retests it successfully (fails to recross).
- Why It Works: Confirms a genuine shift in supply/demand dynamics.
- Signal: Draw a trendline across at least two swing highs (for shorts) or lows (for longs). Enter only after price breaks the trendline and then retests it successfully (fails to recross).
- Candlestick Pattern Confirmation
- Signal: For patterns like Engulfing or Morning Star, wait for a follow‑through candle that closes beyond the pattern’s high (or low) before entry.
- Why It Works: Filters out false patterns that lack follow‑through momentum.
- Signal: For patterns like Engulfing or Morning Star, wait for a follow‑through candle that closes beyond the pattern’s high (or low) before entry.
- Volume‑Weighted Confirmation
- Signal: Require that breakouts occur with above‑average volume (e.g., volume > 1.2× 20‑period average).
- Why It Works: Confirms institutional participation and enhances breakout validity.
- Signal: Require that breakouts occur with above‑average volume (e.g., volume > 1.2× 20‑period average).
3. Tickeron’s AI: Automating & Enhancing Confirmation Trading
Tickeron trains its AI Trading Agents on decades of historical data, teaching them to recognize and act on confirmation patterns across markets and timeframes:
- Multi‑Timeframe Alignment: The AI ingests signals from 1 min to daily charts, requiring cross‑timeframe confirmation—e.g., a 5/8/13‑period alignment on the 5 min and a 50/200‑day golden cross—before executing.
- Backtested Probability Filters: Using OddsMaker™ backtesting, Tickeron’s AI quantifies the historical win rate of each confirmation setup, then weights trades by their statistical edge.
- Adaptive Thresholds: The AI dynamically adjusts parameters (e.g., number of consecutive MACD histogram bars) based on current volatility regimes, ensuring robustness in both calm and choppy markets.
- Pattern Recognition via Machine Learning: Beyond standard indicators, the system employs neural nets to detect complex, non‑linear confirmation patterns—like multi‑leg corrections or fractal price structures—that traditional rules miss.
- Automated Execution & Risk Management: Once confirmation criteria are met, the AI executes orders sub‑second, sets stop‑losses based on average true range, and trails positions as momentum evolves.
4. The Importance of Identifying Support and Resistance Lines
Support and resistance (S/R) lines are foundational to technical analysis—serving as the market’s “battle lines” where buying and selling forces clash. Properly discovering these levels can dramatically improve trade timing, risk management, and overall strategy performance:
- Defining Market Psychology
- Support marks price zones where demand historically outstrips supply, as buyers step in to prevent further declines.
- Resistance represents levels where selling pressure overwhelms buying interest, capping upside moves.
Observing how price reacts at these lines reveals collective trader sentiment—whether bulls are defending their territory or bears are holding the line.
- Support marks price zones where demand historically outstrips supply, as buyers step in to prevent further declines.
- Enhancing Entry and Exit Precision
- Entries: Buying near a support line—especially after confirmation (e.g., a bounce off support with a bullish candlestick)—offers a high‑probability setup with defined risk.
- Exits: Taking profits just below a well‑tested resistance level helps capture gains before the next supply surge.
- Entries: Buying near a support line—especially after confirmation (e.g., a bounce off support with a bullish candlestick)—offers a high‑probability setup with defined risk.
- Setting Logical Stop‑Losses and Targets
- Placing stops just below support or just above resistance aligns your risk tolerance with market structure. You know beforehand if the trade idea is invalidated.
- Measuring the distance between S/R lines provides objective target levels (e.g., support-to-resistance measured‑move targets).
- Placing stops just below support or just above resistance aligns your risk tolerance with market structure. You know beforehand if the trade idea is invalidated.
- Confirming Breakouts and False Breakouts
- A true breakout through resistance, accompanied by volume and successive closes above, confirms a shift in supply/demand and can lead to strong trending moves.
- A false breakout (price piercing S/R but closing back inside) warns of traps and often trades back to the opposite line, offering reversal opportunities.
- A true breakout through resistance, accompanied by volume and successive closes above, confirms a shift in supply/demand and can lead to strong trending moves.
- AI‑Enhanced S/R Discovery
- Automated Line Detection: Tickeron’s AI scans thousands of historical price points to algorithmically plot dynamic support and resistance zones—across intraday and longer timeframes.
- Volume‑Weighted Validation: The system weights S/R lines by the volume traded at those levels, prioritizing the most statistically significant barriers.
- Dynamic Adjustments: In volatile regimes, AI expands or contracts S/R zones based on recent ATR readings, avoiding overly tight or loose levels.
- Integration with Confirmation Rules: Once S/R lines are established, AI agents require confirmation—such as a moving‑average alignment near a support bounce—before executing, ensuring trades respect market structure.
- Automated Line Detection: Tickeron’s AI scans thousands of historical price points to algorithmically plot dynamic support and resistance zones—across intraday and longer timeframes.
Conclusion
Confirmation trading—waiting for multiple signals to align—remains one of the most reliable methods for reducing false entries and improving returns. By embedding these classic techniques within an AI framework, Tickeron’s Trading Agents deliver disciplined, data‑driven execution at scale. Whether you prefer moving‑average crosses, MACD confirmation, or advanced pattern detection, AI ensures that every trade is validated across timeframes and calibrated to prevailing market conditions.
By mastering support and resistance, traders gain a roadmap of market “battle lines,” enabling more precise entries, exits, and risk controls. When these classical principles are embedded within an AI framework, you combine human wisdom with machine speed—achieving robust, systematic trading grounded in objective price levels.
QQQ sees MACD Histogram just turned negative
QQQ saw its Moving Average Convergence Divergence Histogram (MACD) turn negative on November 06, 2025. This is a bearish signal that suggests the stock could decline going forward. Tickeron's A.I.dvisor looked at 43 instances where the indicator turned negative. In of the 43 cases the stock moved lower in the days that followed. This puts the odds of a downward move at .

Technical Analysis (Indicators)
Bearish Trend Analysis
The 10-day RSI Indicator for QQQ moved out of overbought territory on October 30, 2025. This could be a bearish sign for the stock. Traders may want to consider selling the stock or buying put options. Tickeron's A.I.dvisor looked at 49 similar instances where the indicator moved out of overbought territory. In of the 49 cases, the stock moved lower in the following days. This puts the odds of a move lower at .
The Momentum Indicator moved below the 0 level on November 07, 2025. You may want to consider selling the stock, shorting the stock, or exploring put options on QQQ as a result. In of 75 cases where the Momentum Indicator fell below 0, the stock fell further within the subsequent month. The odds of a continued downward trend are .
QQQ moved below its 50-day moving average on November 17, 2025 date and that indicates a change from an upward trend to a downward trend.
Following a 3-day decline, the stock is projected to fall further. Considering past instances where QQQ declined for three days, the price rose further in of 62 cases within the following month. The odds of a continued downward trend are .
Bullish Trend Analysis
The Stochastic Oscillator demonstrated that the ticker has stayed in the oversold zone for 1 day, which means it's wise to expect a price bounce in the near future.
Following a 3-day Advance, the price is estimated to grow further. Considering data from situations where QQQ advanced for three days, in of 382 cases, the price rose further within the following month. The odds of a continued upward trend are .
QQQ may jump back above the lower band and head toward the middle band. Traders may consider buying the stock or exploring call options.
The Aroon Indicator entered an Uptrend today. In of 413 cases where QQQ Aroon's Indicator entered an Uptrend, the price rose further within the following month. The odds of a continued Uptrend are .
Notable companies
Industry description
Market Cap
High and low price notable news
Volume
Fundamental Analysis Ratings
The average fundamental analysis ratings, where 1 is best and 100 is worst, are as follows

Advertisement
General Information
Category LargeGrowth
Advertisement