


Top AI Trading Performers: Tickeron's New FLMs Produce Groundbreaking Outcomes on June 17, 2025
On June 17, 2025, Tickeron marked a pivotal moment in AI-driven trading, showcasing its top-performing agents powered by next-generation Financial Learning Models (FLMs). These models, now more responsive and adaptive due to expanded computational capabilities, are revolutionizing trading strategies by enabling faster learning cycles and real-time adaptability to market volatility.
With the deployment of enhanced 15-minute and 5-minute AI agents, Tickeron has elevated its trading performance and user accessibility. These new Double Agents leverage the synergy between traditional securities and inverse ETFs to provide both hedging and profit-seeking capabilities, without balance limitations.
FLMs at a Glance: Smarter, Faster, Sharper
The latest FLMs incorporate real-time market data analysis with AI-powered pattern recognition. Their main benefits include:
- Reduced emotional trading through machine-led objectivity
- Optimized entry/exit points identified via technical and statistical convergence
- Greater resilience to short-term volatility through dual-position hedging
- User-friendly automation suitable for both beginners and advanced traders
By focusing on mid-timeframe analytics and combining bullish and bearish indicators, FLMs provide a comprehensive trading ecosystem that balances risk and return efficiently.
Top Performers: AI Trading Agents of June 17, 2025
15-Minute Trading Agent
Annualized Return: +830%
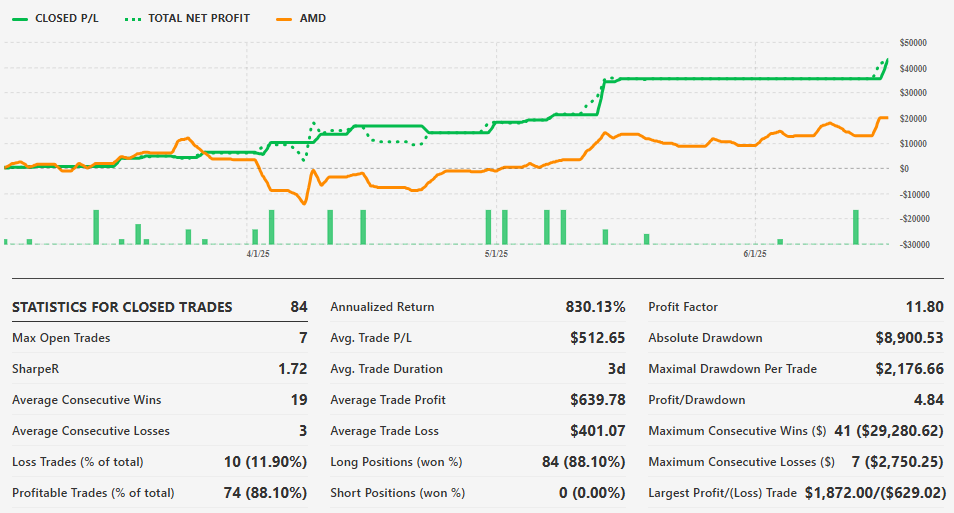
This agent executes a long position in AMD while simultaneously using AMDS, an inverse ETF of AMD, as a hedge.
- AMD: A top-tier semiconductor firm with a diversified portfolio in CPUs, GPUs, gaming consoles, and data centers.
- AMDS: An inverse ETF designed to deliver -100% daily returns relative to AMD’s performance.
Why It Works:
This double agent utilizes high-frequency 15-minute chart analysis, supported by FLM filtering and ML optimization. The swing strategy with daily timeframe confirmations allows for both agility and directional conviction. With automated risk capping and real-time analytics, it combines powerful entry signals with downside hedging.
15-Minute Trading Agent
Annualized Return: +576%
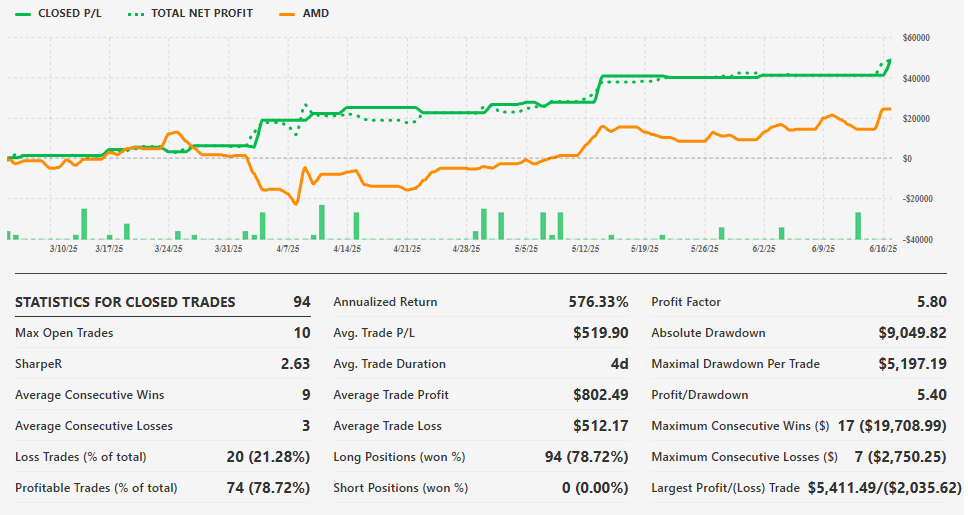
Paired with SOXS—a 3x leveraged inverse ETF of the semiconductor sector—this agent adds more aggressive downside exposure.
- SOXS: Designed to triple the inverse daily performance of the PHLX Semiconductor Sector Index.
- AMD: Core long position ensures tech growth exposure.
Strategic Edge:
SOXS amplifies the hedging effect, giving the agent robust dual-directional capabilities in volatile tech markets. Ideal for active traders, this strategy leverages rapid AI recalibration to stay aligned with intraday momentum.
5-Minute Trading Agent
Annualized Return: +478%
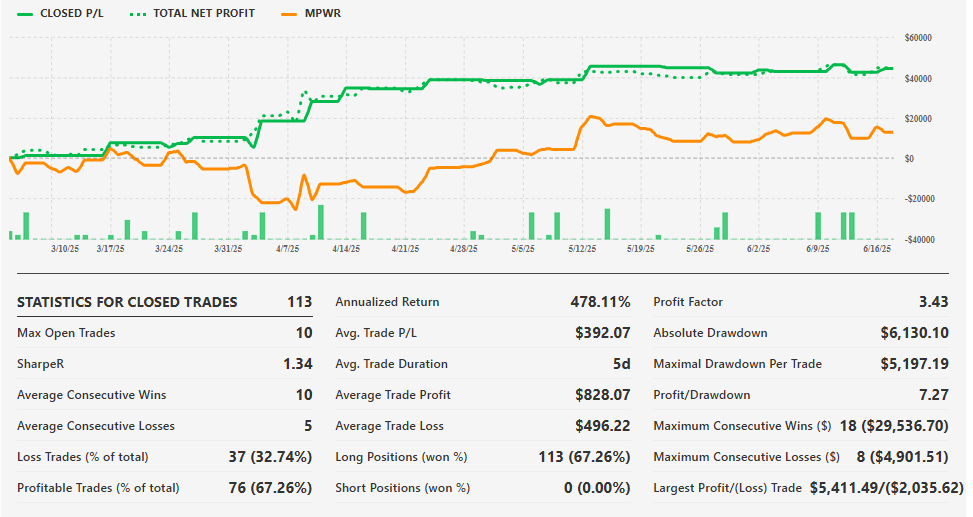
This high-frequency agent features a long position in MPWR and hedges with SOXS.
- MPWR: A fabless chip designer known for energy-efficient analog semiconductors used in automotive and industrial markets.
- SOXS: Serves again as the downside protection instrument.
Why 5 Minutes Matters:
Using 5-minute intervals, the agent captures micro-trends and reacts rapidly to intraday swings. Enhanced ML models detect repeatable patterns with shorter latency, improving timing precision and portfolio turnover without sacrificing risk control.
15-Minute Trading Agent
Annualized Return: +463%
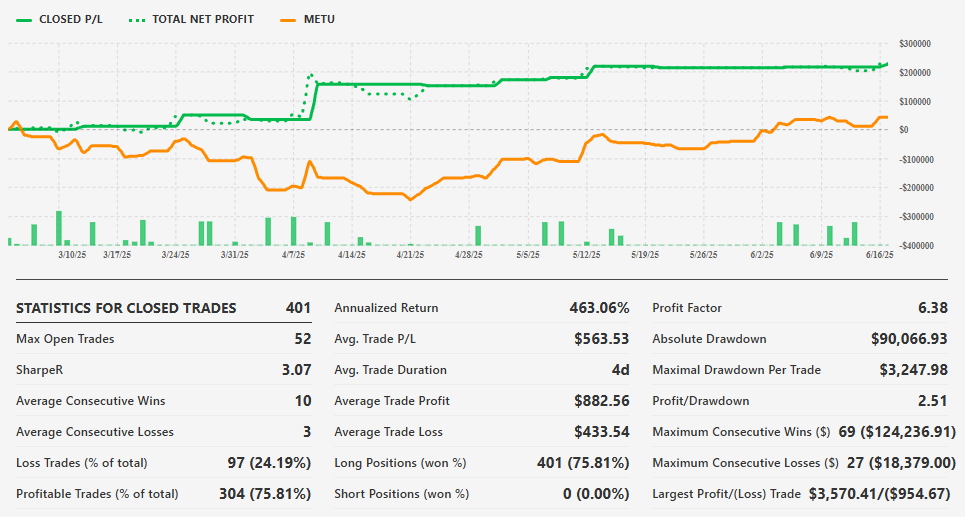
A single-instrument AI agent trading METU, a 2x leveraged fund tied to META (formerly Facebook).
- METU: Offers twice the daily return of META, suited for short-term aggressive growth plays.
Trading Philosophy:
This agent does not hedge but uses FLMs to strictly regulate entry points and trade exposure. The 15-minute chart allows it to capitalize on tech momentum swings, while risk is controlled through capped position limits and daily trend validation.
5-Minute Trading Agent
Annualized Return: +392%
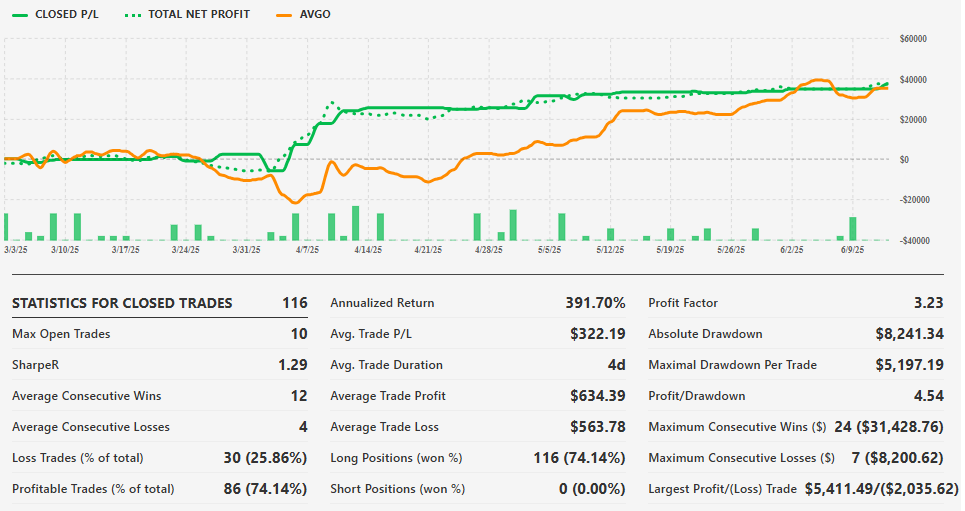
This strategy pairs AVGO (Broadcom) with SOXS for a semiconductor-focused long/short play.
- AVGO: A diversified semiconductor and enterprise software firm with strong revenue streams from Apple and global telecoms.
- SOXS: Complements Broadcom’s long exposure by shorting the broader semiconductor sector.
Performance Strengths:
With Broadcom's stability and SOXS’s leveraged bearish exposure, this agent provides balance in trending and corrective market conditions. The short 5-minute signals make it agile enough to respond to real-time developments while maintaining an edge in both bullish and bearish climates.
The Role of Inverse ETFs in Double Agent Strategies
Each Double Agent utilizes inverse ETFs like AMDS and SOXS for real-time hedging and speculative opportunities. While traditional investors use these instruments cautiously, the Tickeron AI framework ensures inverse ETF volatility is mitigated through smart position sizing, frequent signal reassessment, and daily compounding awareness.
Risk Control and Position Management: Built-in Safety Mechanisms
Across all agent types, Tickeron enforces robust limits:
- Position caps: Max 10 concurrent trades for double agents, 6 for single agents
- Daily trend validation: Ensures trades align with macro movement
- Real-time data feeds: Improve signal accuracy and reduce lag
- Emotion-free execution: Minimizes behavioral biases in trading
These measures ensure a stable experience for beginners while preserving the advanced analytics required by seasoned traders.
Tickeron: The Intelligence Behind the Bots
Tickeron, under the guidance of CEO Sergey Savastiouk, has cemented its position as a leader in AI-powered finance. Its FLMs represent a fusion of market intuition and machine precision, enabling users to leverage institutional-grade analytics in an accessible format.
The platform’s architecture provides:
- High-frequency signal generation
- Integrated inverse and long ETF strategies
- Customizable bots with dual perspective logic
- Onboarding support for all experience levels
This ecosystem allows for scalable participation in financial markets, democratizing access to AI trading tools that were once limited to hedge funds and proprietary desks.
Conclusion: AI Agents, FLMs, and the Future of Trading
The trading results from June 17, 2025, reflect the maturity of Tickeron's AI ecosystem. The top-performing agents—especially the AMD/AMDS double agent at +830% annualized return—demonstrate how intelligent design, real-time adaptation, and well-paired hedging instruments can deliver superior results in dynamic markets.
As Tickeron continues expanding its AI infrastructure, the evolution of Financial Learning Models and trading agents signals a paradigm shift: from reactive to predictive trading, where machines don’t just follow the market—they anticipate it.
AMD in downward trend: price dove below 50-day moving average on September 05, 2025
AMD moved below its 50-day moving average on September 05, 2025 date and that indicates a change from an upward trend to a downward trend. In of 37 similar past instances, the stock price decreased further within the following month. The odds of a continued downward trend are .

Technical Analysis (Indicators)
Bearish Trend Analysis
The Momentum Indicator moved below the 0 level on August 21, 2025. You may want to consider selling the stock, shorting the stock, or exploring put options on AMD as a result. In of 77 cases where the Momentum Indicator fell below 0, the stock fell further within the subsequent month. The odds of a continued downward trend are .
The Moving Average Convergence Divergence Histogram (MACD) for AMD turned negative on August 06, 2025. This could be a sign that the stock is set to turn lower in the coming weeks. Traders may want to sell the stock or buy put options. Tickeron's A.I.dvisor looked at 45 similar instances when the indicator turned negative. In of the 45 cases the stock turned lower in the days that followed. This puts the odds of success at .
Following a 3-day decline, the stock is projected to fall further. Considering past instances where AMD declined for three days, the price rose further in of 62 cases within the following month. The odds of a continued downward trend are .
Bullish Trend Analysis
The RSI Indicator entered the oversold zone -- be on the watch for AMD's price rising or consolidating in the future. That's also the time to consider buying the stock or exploring call options.
The Stochastic Oscillator is in the oversold zone. Keep an eye out for a move up in the foreseeable future.
Following a 3-day Advance, the price is estimated to grow further. Considering data from situations where AMD advanced for three days, in of 303 cases, the price rose further within the following month. The odds of a continued upward trend are .
AMD may jump back above the lower band and head toward the middle band. Traders may consider buying the stock or exploring call options.
The Aroon Indicator entered an Uptrend today. In of 211 cases where AMD Aroon's Indicator entered an Uptrend, the price rose further within the following month. The odds of a continued Uptrend are .
The Tickeron Price Growth Rating for this company is (best 1 - 100 worst), indicating steady price growth. AMD’s price grows at a higher rate over the last 12 months as compared to S&P 500 index constituents.
The Tickeron Profit vs. Risk Rating rating for this company is (best 1 - 100 worst), indicating well-balanced risk and returns. The average Profit vs. Risk Rating rating for the industry is 81, placing this stock slightly better than average.
The Tickeron Valuation Rating of (best 1 - 100 worst) indicates that the company is slightly overvalued in the industry. This rating compares market capitalization estimated by our proprietary formula with the current market capitalization. This rating is based on the following metrics, as compared to industry averages: P/B Ratio (4.110) is normal, around the industry mean (10.960). P/E Ratio (90.503) is within average values for comparable stocks, (71.060). Projected Growth (PEG Ratio) (0.467) is also within normal values, averaging (1.800). AMD has a moderately low Dividend Yield (0.000) as compared to the industry average of (0.022). P/S Ratio (8.333) is also within normal values, averaging (27.791).
The Tickeron SMR rating for this company is (best 1 - 100 worst), indicating weak sales and an unprofitable business model. SMR (Sales, Margin, Return on Equity) rating is based on comparative analysis of weighted Sales, Income Margin and Return on Equity values compared against S&P 500 index constituents. The weighted SMR value is a proprietary formula developed by Tickeron and represents an overall profitability measure for a stock.
The Tickeron PE Growth Rating for this company is (best 1 - 100 worst), pointing to worse than average earnings growth. The PE Growth rating is based on a comparative analysis of stock PE ratio increase over the last 12 months compared against S&P 500 index constituents.
Notable companies
Industry description
Market Cap
High and low price notable news
Volume
Fundamental Analysis Ratings
The average fundamental analysis ratings, where 1 is best and 100 is worst, are as follows


Advertisement
General Information
a manufacturer of integrated circuits for semiconductors
Industry Semiconductors
Advertisement