


TSM July 17 Earnings Preview: Q2 Highlights Amid Chip Boom, Tickeron's Double Agent 55% Return
In the heart of Q2 2025 earnings season (July 14-18), Taiwan Semiconductor Manufacturing Company Ltd. (TSM) emerges as a pivotal player, reporting on Thursday, July 17, 2025, at 2:00 AM ET, with a conference call to follow. As the world's leading chip foundry fueling AI advancements for clients like Nvidia and Apple, (TSM)'s results could underscore the sector's resilience amid global demand surges. This preview delves into anticipated metrics, blending factual projections with strategic trading insights—particularly how Tickeron's specialized AI bots turn such events into profitable opportunities through adaptive, hedged strategies.
Earnings Preview: What to Expect from Taiwan Semiconductor's Q2 Report
Taiwan Semiconductor (TSM) has ridden the AI wave in 2025, with preliminary Q2 revenue reported on July 10 showing a nearly 39% year-over-year surge, reflecting robust demand for advanced nodes. Analysts project revenues around $30.04 billion, exceeding the company's guidance of $28.4 billion to $29.2 billion, driven by high-performance computing chips. EPS estimates hover at $2.37, marking a 60% YoY increase, bolstered by margin improvements and AI-related orders. Morgan Stanley recently turned bullish, forecasting a potential raise in full-year revenue guidance to 27% YoY growth, citing sustained AI momentum.
Recent developments include expansions in Arizona and Japan to diversify supply chains, amid U.S.-China tensions, and partnerships enhancing 2nm and 3nm tech for next-gen AI. Q1 exceeded expectations, and Q2 should continue this trend with booming AI chip demand. Focal points:
- Revenue Growth: High single-digit sequential rise, fueled by AI servers and smartphones; a beat could affirm 2025's 27% projection.
- Margins and Costs: Gross margins around 53-55%, with capex steady at $30-32 billion for capacity builds.
- Guidance: Upward revisions for FY2025, potentially signaling extended AI tailwinds.
- Market Ripple: Strong results might lift semiconductor peers, while supply chain updates could address geopolitical risks.
These elements highlight (TSM)'s AI centrality, but volatility—shares often move 5-8% post-earnings—calls for hedged approaches. Tickeron's AI bots, like the TSM-specific Double Agent, integrate such dynamics seamlessly.
Capitalizing on TSM Earnings with Tickeron's AI Trading Bots: The Double Agent Advantage
(TSM)'s earnings volatility, amplified by AI hype and sector swings, presents ideal setups for AI-driven trading. Tickeron's bots, powered by Financial Learning Models (FLMs), process price action, volume, news, and macros for predictive signals, adapting across conditions.
The June 23, 2025 innovation launched agents with 15- and 5-minute ML frames, enabling precise intraday shifts beyond 60-minute standards. Tests validate enhanced responsiveness, as CEO Sergey Savastiouk, Ph.D., highlighted: "Our 15- and 5-minute ML cycles deliver unprecedented precision, empowering traders with tools previously exclusive to institutional investors." Available now, they democratize AI via real-time pattern recognition.
Tailored for (TSM), the TSM / SOXS – AI Trading Double Agent, 60 min. Virtual Agent employs a hybrid "Double Agent" strategy: longing TSM for upside while hedging with SOXS (Direxion Daily Semiconductor Bear 3X Shares ETF), an inverse leveraged ETF tracking -3x the ICE Semiconductor Index. This allows profits in any direction—bullish on TSM's growth or bearish via SOXS during downturns—mitigating risks like post-earnings drops.
The Double Agent Strategy: Dual Momentum and Inverse Hedging
This swing trader uses multi-timeframe patterns: H1/H4 for entries, Daily for exits and filters. Proprietary algorithms validate high-probability setups, leveraging FLMs for trend confirmation.
- Momentum Agent (Long TSM): Captures upward trends in TSM, the chip giant manufacturing for AI leaders, entering on intraday patterns.
- Inverse Agent (Long SOXS as Hedge): Deploys during reversals, profiting from semiconductor declines via SOXS's -3x leverage—effectively shorting without direct borrowing.
- Pattern Recognition: FLMs detect anomalies across timeframes, ensuring entries align with momentum while Daily signals trigger exits for precision.
- Trade Flow: Up to 6 open positions, blending long TSM with hedged SOXS for resilience.
This dual approach shines in volatile periods like earnings, turning TSM's AI-driven swings into balanced gains.
Position and Risk Management: Hedging for Stability
Risk is managed dynamically:
- Hedging Mechanism: SOXS counters TSM downturns, reducing drawdowns in unpredictable markets.
- Controls: FLMs optimize entries/exits; low max positions focus strategy.
- Beginner-Friendly: Automated execution suits all levels, with real-time insights.
- Dynamics: Medium volatility; low diversification (TSM/SOXS focus); medium profit/drawdown for balanced intermediates/experts.
Optimal in medium volatility, aligning with semiconductor fluctuations.
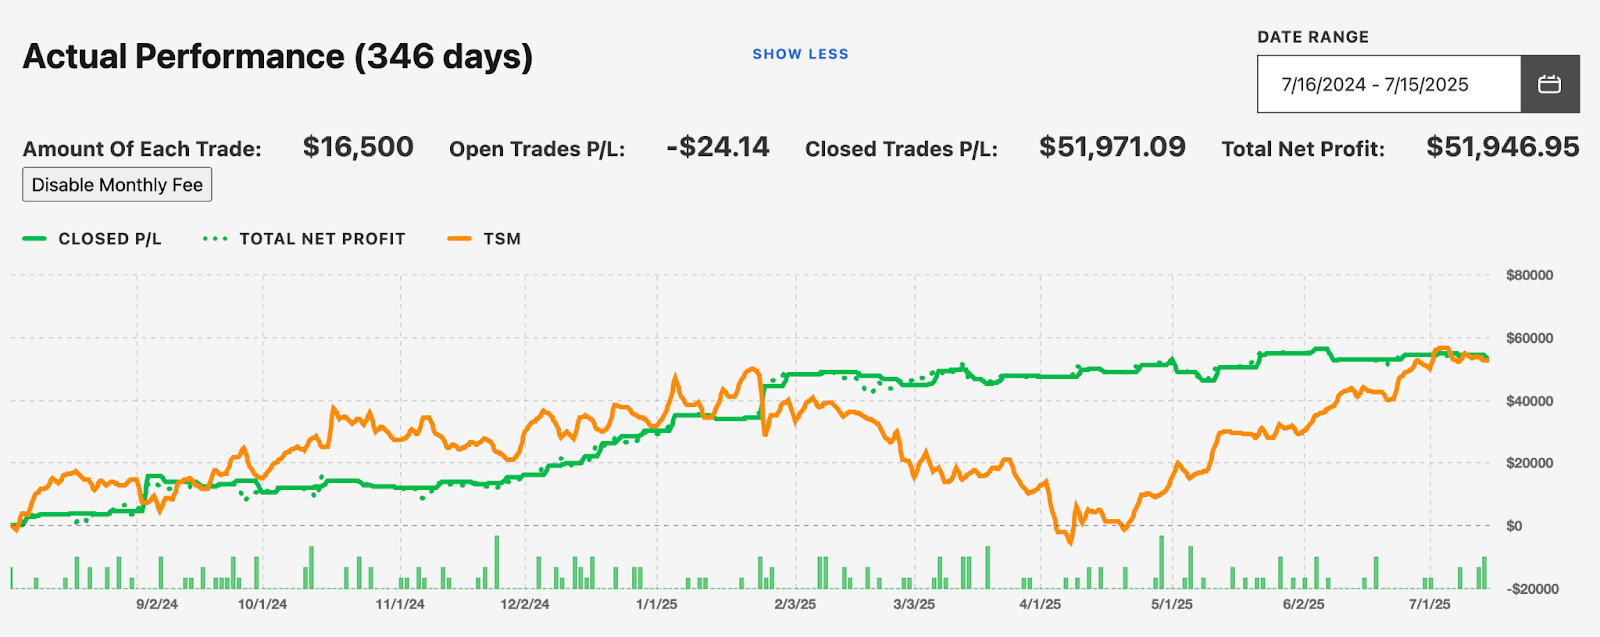
Performance: Delivering High Returns Through Adaptive Trading
Over 346 days at $16,500/trade, it achieved $51,946.95 net profit (post-fees), a 55.11% annualized return. Of 167 trades, 109 profitable (65.27% win rate), averaging $824.62 gains vs. $636.60 losses—profit factor 2.43. Profit/drawdown 7.19 (high resilience); Sharpe ratio 0.77; 16 consecutive wins ($15,672.98). All longs (TSM focus); 4-day average duration. Real-time Morningstar data, no bias.
Explore: TSM / SOXS – AI Trading Double Agent, 60 min. Paper/live modes, FLMs evolve for accuracy.
Why Double Agent AI Outperforms Traditional Trading in Earnings Seasons
For (TSM)'s report, manual strategies falter on rapid shifts. This bot's FLMs and hedging via SOXS provide edge: profiting bidirectionally with 55% returns, high win rates. Benefits:
- Versatility: Long TSM for growth, hedge with inverse ETF for protection.
- Efficiency: Multi-timeframe automation frees traders; low positions ease oversight.
- Risk Mitigation: Superior ratios (7.19 profit/drawdown) weather volatility.
- Innovation: Ultra-fast ML frames boost precision, ideal for AI news reactions.
Whether capitalizing on (TSM)'s revenue beat or hedging risks, this bot optimizes outcomes. Visit Tickeron for demos, stats, and trials. Harness AI for semiconductor trading success.
TSM in +1.57% Uptrend, advancing for three consecutive days on August 27, 2025
Moving higher for three straight days is viewed as a bullish sign. Keep an eye on this stock for future growth. Considering data from situations where TSM advanced for three days, in of 315 cases, the price rose further within the following month. The odds of a continued upward trend are .

Technical Analysis (Indicators)
Bullish Trend Analysis
TSM may jump back above the lower band and head toward the middle band. Traders may consider buying the stock or exploring call options.
The Aroon Indicator entered an Uptrend today. In of 238 cases where TSM Aroon's Indicator entered an Uptrend, the price rose further within the following month. The odds of a continued Uptrend are .
Bearish Trend Analysis
The Stochastic Oscillator may be shifting from an upward trend to a downward trend. In of 69 cases where TSM's Stochastic Oscillator exited the overbought zone, the price fell further within the following month. The odds of a continued downward trend are .
The Momentum Indicator moved below the 0 level on August 20, 2025. You may want to consider selling the stock, shorting the stock, or exploring put options on TSM as a result. In of 82 cases where the Momentum Indicator fell below 0, the stock fell further within the subsequent month. The odds of a continued downward trend are .
TSM moved below its 50-day moving average on August 29, 2025 date and that indicates a change from an upward trend to a downward trend.
Following a 3-day decline, the stock is projected to fall further. Considering past instances where TSM declined for three days, the price rose further in of 62 cases within the following month. The odds of a continued downward trend are .
The Tickeron Valuation Rating of (best 1 - 100 worst) indicates that the company is slightly undervalued in the industry. This rating compares market capitalization estimated by our proprietary formula with the current market capitalization. This rating is based on the following metrics, as compared to industry averages: P/B Ratio (8.000) is normal, around the industry mean (11.162). P/E Ratio (25.362) is within average values for comparable stocks, (75.600). Projected Growth (PEG Ratio) (1.423) is also within normal values, averaging (2.116). Dividend Yield (0.012) settles around the average of (0.022) among similar stocks. P/S Ratio (10.776) is also within normal values, averaging (28.100).
The Tickeron Profit vs. Risk Rating rating for this company is (best 1 - 100 worst), indicating low risk on high returns. The average Profit vs. Risk Rating rating for the industry is 81, placing this stock better than average.
The Tickeron SMR rating for this company is (best 1 - 100 worst), indicating very strong sales and a profitable business model. SMR (Sales, Margin, Return on Equity) rating is based on comparative analysis of weighted Sales, Income Margin and Return on Equity values compared against S&P 500 index constituents. The weighted SMR value is a proprietary formula developed by Tickeron and represents an overall profitability measure for a stock.
The Tickeron Price Growth Rating for this company is (best 1 - 100 worst), indicating steady price growth. TSM’s price grows at a higher rate over the last 12 months as compared to S&P 500 index constituents.
The Tickeron PE Growth Rating for this company is (best 1 - 100 worst), pointing to worse than average earnings growth. The PE Growth rating is based on a comparative analysis of stock PE ratio increase over the last 12 months compared against S&P 500 index constituents.
Notable companies
Industry description
Market Cap
High and low price notable news
Volume
Fundamental Analysis Ratings
The average fundamental analysis ratings, where 1 is best and 100 is worst, are as follows


Advertisement
General Information
a manufacturer of integrated circuits, silicon wafers, diodes and related semiconductor components
Industry Semiconductors
Advertisement