Screener of ETF Bearish Pennant
AI Pattern Search Engine (PSE)
Operating the Pattern Search Engine is easy and straightforward
- Set up pattern search criteria
- Receive patterns in your feed
- Bookmark patterns to track their status
How It Works
Trading patterns is one of the most sophisticated trading strategies. It exploits the psychology of market participants, and takes advantage of the knowledge of market insights.If you want to use AI to discover these hidden effects, then Tickeron’s Pattern Search Engine is the tool you need. Using PSE, AI will teach you to recognize patterns and entry and exit points.
Pattern Types and Stats


Pennant


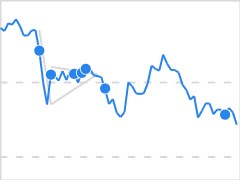
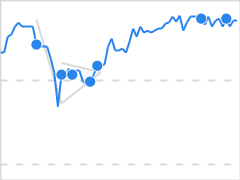
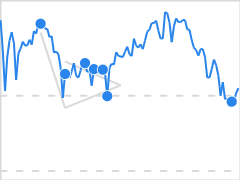
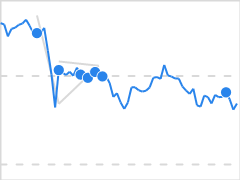
The Falling Pennant (or Bearish Pennant) pattern looks like a pennant turned upside down (the mast points up). It forms when falling prices experience a consolidation period, and the price moves within a narrow range defined by the converging lines through points (2, 4) and (3, 5). After the consolidation, the previous trend resumes.
This type of formation happens when anticipation of downtrend is high, and when the price of a security consolidates during a declining trend. It may indicate growing investor concern of an impending downtrend.
Trade Idea
If the price breaks out from the bottom pattern boundary, day traders and swing traders should trade with a DOWN trend. Consider selling the security short or buying a put option at the downward breakout price level. The breakout price level for the Falling Pennant pattern is the last point touching the bottom pattern line (point 4). To identify an exit, calculate the pattern height which is the initial fall between points 1 and 2. Then, subtract the pattern height from the breakout price. When trading, wait for the confirmation move, which is when the price falls below the breakout level.
To limit potential loss when price suddenly goes in the wrong direction, consider placing a stop order to buy back a short position or sell a put option at or above the breakout price.