Screener of ETF Bearish Rectangle Bottom
AI Pattern Search Engine (PSE)
Operating the Pattern Search Engine is easy and straightforward
- Set up pattern search criteria
- Receive patterns in your feed
- Bookmark patterns to track their status
How It Works
Trading patterns is one of the most sophisticated trading strategies. It exploits the psychology of market participants, and takes advantage of the knowledge of market insights.If you want to use AI to discover these hidden effects, then Tickeron’s Pattern Search Engine is the tool you need. Using PSE, AI will teach you to recognize patterns and entry and exit points.
Pattern Types and Stats


Rectangle Bottom


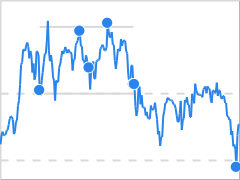
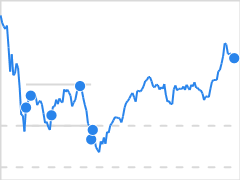
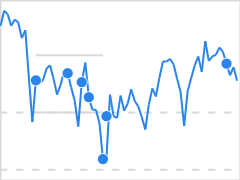
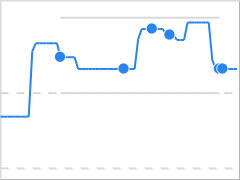
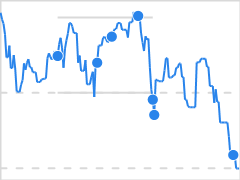
The Rectangle Bottom pattern forms when the price of a security is stuck in a rangebound motion, bouncing between support and resistance levels. Two horizontal lines (1, 3, 5) and (2, 4) form the pattern. Depending on who gives up first buyers or sellers the price can Breakout in either direction.
This pattern is commonly associated with directionless markets. Usually the pattern performs better when there is a strong downtrend leading into the formation.
Trade Idea
If price breaks out from the bottom pattern boundary, day traders and swing traders should trade with a DOWN trend. Consider selling the security short or buying a put option at the downward breakout price level. To identify an exit, calculate the pattern’s height by taking the difference between the support and resistance levels. Then, subtract the pattern height from the breakout price to calculate the target price.
To limit potential loss when price suddenly goes in the wrong direction, consider placing a stop order to buy back a short position or sell a put option at or above the breakout price.