Screener of ETF Bearish Triangle Descending
AI Pattern Search Engine (PSE)
Operating the Pattern Search Engine is easy and straightforward
- Set up pattern search criteria
- Receive patterns in your feed
- Bookmark patterns to track their status
How It Works
Trading patterns is one of the most sophisticated trading strategies. It exploits the psychology of market participants, and takes advantage of the knowledge of market insights.If you want to use AI to discover these hidden effects, then Tickeron’s Pattern Search Engine is the tool you need. Using PSE, AI will teach you to recognize patterns and entry and exit points.
Pattern Types and Stats


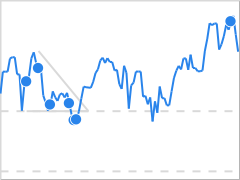
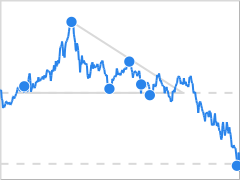
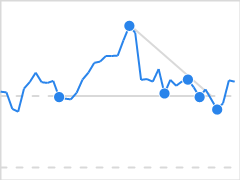
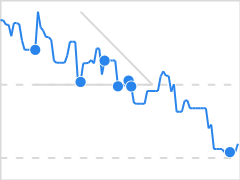
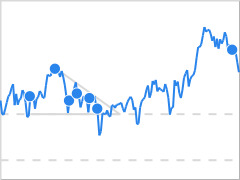
Triangle Descending


The Descending Triangle pattern has a horizontal bottom (1, 3, 5) which represents the support level, and a down-sloping top line (2, 4). The breakout can be either up or down and the direction of the breakout determines which corresponding price level is the target.
This pattern is commonly associated with directionless markets since the contraction (narrowing) of the market range signals that neither bulls nor bears are in control. When the price of a security consolidates in a somewhat volatile fashion, it may indicate growing investor concern that the price is set to break out.
Trade Idea
If the price breaks out from the bottom pattern boundary, day traders and swing traders should trade with the DOWN trend. Consider selling the security short or buying a put option at the downward breakout price level. To identify an exit, compute the target price, by subtracting the pattern height from the breakout point. For downward breakouts the breakout level is the bottom horizontal line (1, 3, 5). Pattern height is the difference between the level of the bottom horizontal line and the highest high.
To limit potential loss when price suddenly goes in the wrong direction, consider placing a stop order to buy back a short position or sell a put option at or above the breakout price.