


Analysis of Horizon Aircraft (HOVR) Stock: June 2025 Performance, Industry Trends, and AI-Powered Perspectives
Horizon Aircraft, trading under the ticker HOVR on NASDAQ, is an advanced aerospace engineering company specializing in hybrid electric Vertical Take-Off and Landing (eVTOL) aircraft, notably the Cavorite X7. In June 2025, HOVR captured significant investor attention due to its remarkable stock performance, surging +302.15% over the month with an average daily trading volume of 2 million shares. This article provides a comprehensive analysis of HOVR’s stock performance, key market news as of June 16, 2025, comparisons with correlated stocks and inverse ETFs, and the role of AI-driven tools like those offered by Tickeron in navigating its market movements.
HOVR Stock Performance: A Stellar June 2025
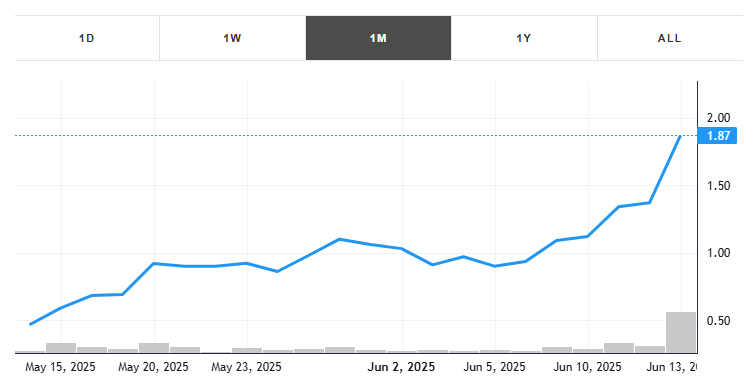
HOVR’s stock experienced an extraordinary rally in June 2025, gaining +302.15% and closing at approximately $1.81 per share on June 13, 2025, with a peak volume of 17.4 million shares on that day. The stock’s market capitalization reached $72.19 million, with a float of 16.25 million shares and a short interest of 1.79%. Social media sentiment on platforms like X highlighted HOVR’s breakout potential, with traders projecting price targets above $2.50 if the upward trend persists. This surge was driven by a low float, high trading volume, and significant news catalysts, positioning HOVR as a top gainer in the aerospace and defense sector.
Key Catalyst: Strategic Partnership with MT-Propeller
On June 13, 2025, Horizon Aircraft announced a strategic partnership with MT-Propeller, a global leader in advanced propeller technology, to supply propellers for the Cavorite X7’s hybrid turbine engine. This deal marked Horizon’s first major hardware commitment for full-scale production, signaling progress toward commercializing its innovative eVTOL aircraft. The partnership fueled a +46% stock price surge in the week prior to June 13, with posts on X noting the deal’s potential to drive HOVR toward $2.50+ due to its niche advantage in runway-capable hybrid eVTOL technology.
Popular Market Movements: June 16, 2025
The broader market in June 2025 was marked by volatility and significant developments. The S&P 500 index faced turbulence following President Trump’s tariff announcements in April, which caused a 19% drop, narrowly avoiding bear market territory. However, a rebound in April and May saw the S&P 500 rise 19.6% over 27 trading days, driven by optimism over softer inflation data and U.S.-China trade negotiation progress. Meanwhile, geopolitical tensions, including Israel’s attacks on Iran’s nuclear program on June 13, shook global markets, boosting oil prices and the S&P 500 Energy Select ETF (XLE) by over 1%. Tech giants like Amazon (AMZN) gained 6.75% over five days, driven by AI investments and trade optimism, while Tesla (TSLA) saw a 30% price jump over the last quarter. These movements underscore a market environment balancing trade optimism, geopolitical risks, and AI-driven growth, all of which contextualize HOVR’s aerospace sector rally.
Comparison with Correlated Stock: Joby Aviation (JOBY)
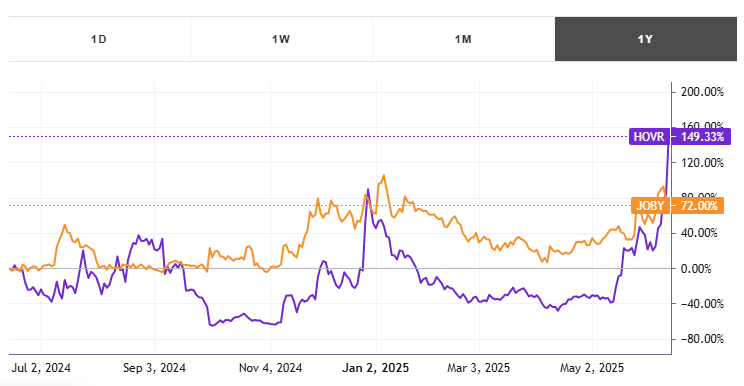
HOVR’s performance can be compared to Joby Aviation (JOBY), another eVTOL company with a high positive correlation to HOVR due to shared market dynamics in the urban air mobility sector. Over the five trading days ending June 10, 2025, JOBY gained approximately 4.5%, underperforming HOVR’s explosive growth but reflecting similar investor enthusiasm for eVTOL innovation. Both companies benefit from the growing demand for sustainable aviation solutions, but HOVR’s lower market cap ($72.19M vs. JOBY’s $1.2B) and recent production milestone give it higher volatility and upside potential. Investors tracking HOVR can use Tickeron’s platform to compare real-time trends and analytics for both stocks.
Inverse ETFs: Hedging HOVR’s Volatility
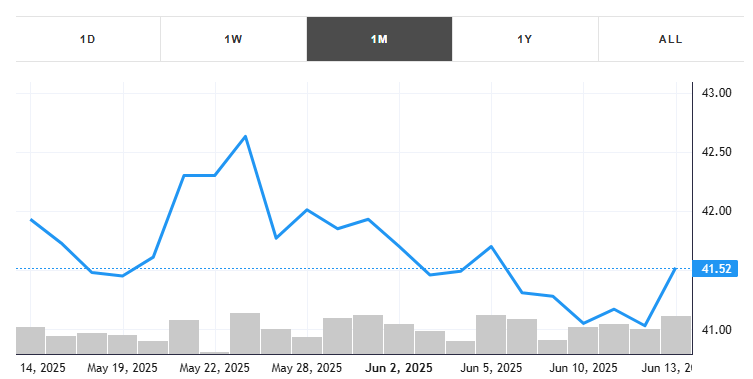
For traders seeking to hedge HOVR’s volatility, inverse ETFs like the ProShares Short S&P 500 (SH) offer an anti-correlated instrument. SH aims to deliver the daily inverse performance of the S&P 500, which indirectly anti-correlates with HOVR due to its inclusion in broader market indices. During HOVR’s rally in June 2025, SH likely declined by a similar magnitude, reflecting its inverse relationship. Inverse ETFs carry higher risks due to daily rebalancing and are best suited for short-term strategies. Tickeron’s AI tools can help traders identify optimal entry and exit points for SH to mitigate HOVR’s volatility, ensuring precise hedging in high-risk scenarios.
Tickeron’s AI Trading Agents: Revolutionizing HOVR Strategies
Tickeron, led by CEO Sergey Savastiouk, is transforming financial markets with its Financial Learning Models (FLMs). These models combine technical analysis with machine learning to detect market patterns with precision. Tickeron’s AI Trading Robots and Double Agents, accessible at Tickeron’s bot-trading platform, enable traders to capitalize on HOVR’s bullish and bearish signals simultaneously. For instance, Tickeron’s AI identified a bullish moving average crossover for HOVR on May 15, 2025, signaling potential upside to $2.50. By pairing HOVR with inverse ETFs like SH, Tickeron’s Double Agents offer a hedged approach, reducing risk while amplifying returns. This dual perspective aligns with the growing role of AI in financial decision-making, making Tickeron an essential tool for navigating HOVR’s volatile trajectory.
Outlook and Risks
Analyst sentiment for HOVR remains optimistic, with projections suggesting potential upside to $2.50+ if production milestones are met. However, risks include macroeconomic uncertainties, such as global trade tensions and geopolitical conflicts, which could impact aerospace investments. HOVR’s low float and high volatility also pose challenges for risk-averse investors. Using Tickeron’s AI-driven insights, traders can monitor real-time patterns and macroeconomic factors to make informed decisions. As Horizon Aircraft advances toward Cavorite X7 production, its stock remains a compelling option for investors seeking exposure to the eVTOL sector.
HOVR in -2.44% downward trend, sliding for three consecutive days on September 05, 2025
Moving lower for three straight days is viewed as a bearish sign. Keep an eye on this stock for future declines. Considering data from situations where HOVR declined for three days, in of 115 cases, the price declined further within the following month. The odds of a continued downward trend are .

Technical Analysis (Indicators)
Bearish Trend Analysis
The Moving Average Convergence Divergence Histogram (MACD) for HOVR turned negative on September 03, 2025. This could be a sign that the stock is set to turn lower in the coming weeks. Traders may want to sell the stock or buy put options. Tickeron's A.I.dvisor looked at 18 similar instances when the indicator turned negative. In of the 18 cases the stock turned lower in the days that followed. This puts the odds of success at .
HOVR moved below its 50-day moving average on September 03, 2025 date and that indicates a change from an upward trend to a downward trend.
HOVR broke above its upper Bollinger Band on August 26, 2025. This could be a sign that the stock is set to drop as the stock moves back below the upper band and toward the middle band. You may want to consider selling the stock or exploring put options.
Bullish Trend Analysis
The Stochastic Oscillator is in the oversold zone. Keep an eye out for a move up in the foreseeable future.
The Momentum Indicator moved above the 0 level on September 03, 2025. You may want to consider a long position or call options on HOVR as a result. In of 33 past instances where the momentum indicator moved above 0, the stock continued to climb. The odds of a continued upward trend are .
The 10-day moving average for HOVR crossed bullishly above the 50-day moving average on August 28, 2025. This indicates that the trend has shifted higher and could be considered a buy signal. In of 6 past instances when the 10-day crossed above the 50-day, the stock continued to move higher over the following month. The odds of a continued upward trend are .
Following a 3-day Advance, the price is estimated to grow further. Considering data from situations where HOVR advanced for three days, in of 92 cases, the price rose further within the following month. The odds of a continued upward trend are .
The Tickeron PE Growth Rating for this company is (best 1 - 100 worst), pointing to outstanding earnings growth. The PE Growth rating is based on a comparative analysis of stock PE ratio increase over the last 12 months compared against S&P 500 index constituents.
The Tickeron Price Growth Rating for this company is (best 1 - 100 worst), indicating steady price growth. HOVR’s price grows at a higher rate over the last 12 months as compared to S&P 500 index constituents.
The Tickeron Valuation Rating of (best 1 - 100 worst) indicates that the company is significantly overvalued in the industry. This rating compares market capitalization estimated by our proprietary formula with the current market capitalization. This rating is based on the following metrics, as compared to industry averages: HOVR's P/B Ratio (117.647) is very high in comparison to the industry average of (9.988). P/E Ratio (12.983) is within average values for comparable stocks, (65.559). HOVR's Projected Growth (PEG Ratio) (0.000) is slightly lower than the industry average of (1.788). Dividend Yield (0.000) settles around the average of (0.016) among similar stocks. P/S Ratio (0.000) is also within normal values, averaging (9.094).
The Tickeron SMR rating for this company is (best 1 - 100 worst), indicating weak sales and an unprofitable business model. SMR (Sales, Margin, Return on Equity) rating is based on comparative analysis of weighted Sales, Income Margin and Return on Equity values compared against S&P 500 index constituents. The weighted SMR value is a proprietary formula developed by Tickeron and represents an overall profitability measure for a stock.
The Tickeron Profit vs. Risk Rating rating for this company is (best 1 - 100 worst), indicating that the returns do not compensate for the risks. HOVR’s unstable profits reported over time resulted in significant Drawdowns within these last five years. A stable profit reduces stock drawdown and volatility. The average Profit vs. Risk Rating rating for the industry is 59, placing this stock worse than average.
Notable companies
Industry description
Market Cap
High and low price notable news
Volume
Fundamental Analysis Ratings
The average fundamental analysis ratings, where 1 is best and 100 is worst, are as follows


Advertisement
General Information
Industry AerospaceDefense
Advertisement