


Analysis of Rocket Lab Corporation's Stock: A 164% Increase from $14.71 to $38.88 in Q2 2025
Rocket Lab Corporation (RKLB) has delivered one of the most remarkable stock performances in the aerospace sector during the second quarter of 2025, surging from its April 7 low of $14.71 to July 7's closing price of $38.88 – representing a staggering 164% gain. This extraordinary rise has propelled the small satellite launch provider to all-time highs, fundamentally reshaping its market position and investor perception in the rapidly expanding commercial space industry.
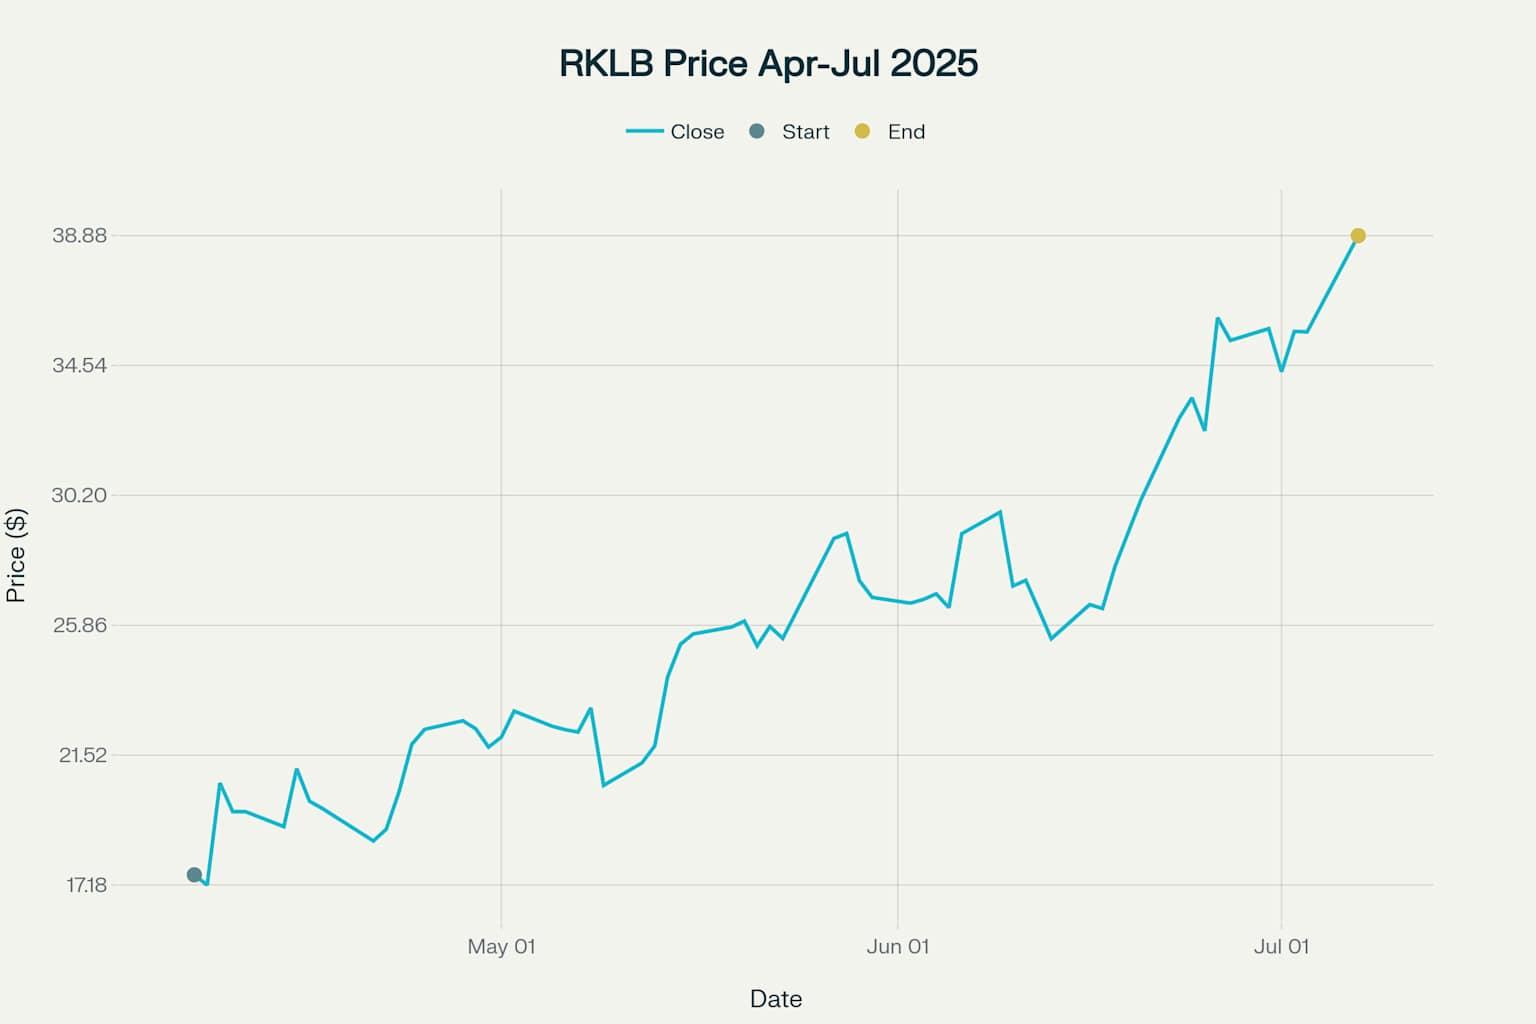
Rocket Lab Corporation (RKLB) Stock Price Performance: April 7 - July 7, 2025 showing remarkable 122% gain from $17.52 to $38.88
Understanding Rocket Lab: The End-to-End Space Company
Core Business Operations
Rocket Lab USA, Inc. is an end-to-end space company headquartered in Long Beach, California, with established operations across the United States, New Zealand, Canada, and Australia. The company delivers reliable launch services, spacecraft design services, spacecraft components, spacecraft manufacturing, and other spacecraft and on-orbit management solutions that make it faster, easier, and more affordable to access space.
The company operates through two primary business segments:
Launch Services: The design, manufacture, and launch of orbital rockets to deploy payloads to various Earth orbits and interplanetary destinations. Rocket Lab's flagship Electron orbital small launch vehicle has completed 68 successful launches as of June 2025, delivering over 227 satellites to orbit for government and commercial customers.
Space Systems: The design and manufacture of spacecraft components and spacecraft program management services, space data applications, and mission operations. This segment has become increasingly vital, generating $87 million in Q1 2025 compared to $35.6 million from Launch Services.
Technological Innovation and Competitive Advantages
Rocket Lab has established several key technological differentiators:
- Rutherford engines: The first electric-pump-fed engines to power an orbital rocket, with over 450 engines launched to space as of December 2023
- Carbon composite construction: Delivering substantial mass-savings while maintaining structural integrity
- 3D printing capabilities: Revolutionary manufacturing processes for rapid design and production
- Private orbital launch ranges: Operating one of the only private orbital launch ranges globally in New Zealand
The Catalysts Behind the 164% Rally
Major Defense Contract Wins
The surge began with Rocket Lab's selection for the U.S. Space Force's National Security Space Launch (NSSL) Phase 3 program, receiving a $5 million task order for initial capability assessment. This contract positions Rocket Lab to compete for upcoming national security launch assignments worth potentially $5.6 billion.
Additionally, Rocket Lab secured positions in two multi-billion dollar government programs:
- U.S. Air Force Enterprise-Wide Agile Acquisition Contract (EWAAC): A $46 billion indefinite delivery-indefinite quantity contract for innovative technologies and engineering services
- UK Ministry of Defence Hypersonic Technologies & Capability Development Framework: A ~$1.3 billion framework for developing advanced hypersonic capabilities
Strategic Acquisitions Expanding Market Reach
GEOST Acquisition: Entering the Payload Market
On May 27, 2025, Rocket Lab announced its acquisition of GEOST LLC for $275 million, marking the company's first venture into the satellite payload industry. The deal structure includes:
- $125 million in cash
- $150 million in Rocket Lab shares
- Up to $50 million in potential earnouts based on revenue targets
GEOST provides advanced electro-optical (EO) and infrared (IR) sensor systems for missile warning and tracking, tactical intelligence, surveillance, and reconnaissance, Earth observation, and space domain awareness. This acquisition adds 115 employees and facilities in Tucson, Arizona, and northern Virginia to Rocket Lab's global footprint.
Financial Performance and Growth Trajectory
Rocket Lab's Q1 2025 financial results demonstrated strong momentum:
- Revenue: $122.6 million (32.1% year-over-year increase)
- Space Systems revenue: $87 million (significant growth driver)
- Launch Services revenue: $35.6 million
- Cash and equivalents: $517 million
- Contracted revenue backlog: $1.067 billion
The company's revenue has grown from $62 million in 2021 to $436 million in 2024, representing more than sevenfold growth. For 2025, analysts project revenues of $599.2 million, representing a 37% increase from the previous year.
Neutron Rocket Development Progress
Rocket Lab has made significant progress on its medium-lift Neutron rocket, designed to compete directly with SpaceX's Falcon 9:
- Payload capacity: 13,000 kg to low Earth orbit in reusable configuration
- First launch target: Second half of 2025
- Development investment: Approximately $200 million
Key milestones achieved include:
- Stage 2 qualification completed in early April 2025
- First stage testing progressing with complex mechanical systems validation
- Archimedes engine development with successful hot fire tests
Russell 1000 Index Inclusion
Rocket Lab's inclusion in the Russell 1000 Index on June 30, 2025, marked a significant institutional recognition milestone. This reclassification from the Russell 2000 small-cap index to the mid-cap Russell 1000 triggered:
- $200 billion in passive fund rebalancing as index-tracking ETFs purchased RKLB shares
- 40% stock price surge since June 13, 2025
- Enhanced liquidity and reduced volatility from institutional inflows
Trump-Musk Tensions Benefiting Alternatives
The public dispute between President Trump and SpaceX CEO Elon Musk has created unexpected opportunities for Rocket Lab. When Musk threatened to halt Dragon spacecraft flights in response to Trump's contract threats, NASA and the Pentagon contacted alternative spaceflight providers, including Rocket Lab, about the readiness of their launch systems. This highlighted the risks of single-provider dependence and potentially opened doors for diversification of government contracts.
Operational Excellence and Launch Cadence
Record-Breaking Performance
Rocket Lab has maintained exceptional operational performance throughout 2025:
- 100% mission success rate for all Electron launches in 2025
- 10 Electron missions completed by June 2025
- Record launch turnaround: Less than 48 hours between missions from the same launch complex
The company operates from dual orbital launch sites:
- Launch Complex 1: Mahia Peninsula, New Zealand (two launch pads)
- Launch Complex 2: Wallops Island, Virginia (one launch pad)
Combined, these facilities can support more than 130 launch opportunities annually, providing unmatched flexibility for rapid, responsive launches.
Recent Mission Successes
Notable 2025 missions include:
- "Symphony In The Stars": Deployed confidential commercial satellite to 650km circular orbit
- "Get The Hawk Outta Here": Deployed four satellites for HawkEye 360's constellation
- Multi-launch contracts: Secured deals with iQPS for four Electron missions and Synspective for ten launches
Market Position and Industry Context
The Expanding Space Economy
The global space economy reached an estimated $415 billion in revenue in 2024, with commercial satellite activities accounting for $293 billion (71%). The industry is projected to grow to $944 billion by 2033, driven largely by downstream solutions leveraging satellite data.
The satellite communications market specifically shows strong growth prospects, with broadband equipment revenue expected to grow at a compound annual growth rate (CAGR) of 12% through 2033. The total addressable market for satellite payloads could reach $4-5 billion and user terminals $5-6 billion by the end of the decade.
Competitive Landscape
Rocket Lab operates in an increasingly competitive environment:
Small Launch Market: Rocket Lab's Electron has become the second most frequently launched small orbital rocket globally, establishing clear market leadership in the dedicated small satellite launch segment.
Medium Launch Competition: The upcoming Neutron rocket will compete directly with:
- SpaceX Falcon 9: 22,800 kg payload capacity, dominant market position
- Blue Origin New Glenn: Under development
- ULA Vulcan: Recently operational
- Arianespace Ariane 6: Recently operational
Space Systems Market: Competing against established players like Airbus, Boeing, Lockheed Martin, Northrop Grumman, and emerging companies in satellite manufacturing and components.
Analyst Sentiment and Price Targets
Wall Street analysts maintain a "Moderate Buy" consensus on Rocket Lab with significant price target variations:
Recent Analyst Actions:
- KeyBanc (July 2025): Raised price target from $29 to $40, maintaining Overweight rating
- Goldman Sachs (June 2025): Initiated coverage with Hold rating, $27 price target
- Cantor Fitzgerald (June 2025): Raised price target from $29 to $35, maintaining Buy rating
- Roth Capital (May 2025): Raised price target from $25 to $35, maintaining Strong Buy rating
The consensus average price target stands at $29.33, though this appears conservative given the stock's current price of $38.88.
Challenges and Risks Ahead
Neutron Development Concerns
Recent analysis has raised questions about Rocket Lab's mid-2025 launch timeline for Neutron. Industry experts suggest potential delays to mid-2026 or later, citing challenges in:
- Engine development and qualification
- Structural production scaling
- Launch pad construction completion
- Transportation logistics
Financial Requirements
Experts estimate Rocket Lab will need between $300-600 million to complete Neutron's development and reach profitability. With $504 million in cash as of September 2024, additional capital raises may be necessary, potentially diluting existing shareholders.
Competitive Pressures
SpaceX's market dominance remains formidable, accounting for 86% of global upmass launched in 2024 while Rocket Lab ranked ninth with less than 0.1%. The Falcon 9's cost advantages and established reliability create significant competitive barriers for new entrants like Neutron.
Execution Risks
Key risks include:
- Technical challenges in achieving Neutron's reusability targets
- Schedule delays potentially impacting NSSL Phase 3 qualification
- Market competition from established and emerging players
- Capital requirements for continued growth and development
Future Outlook and Strategic Direction
Near-Term Catalysts
2025 Expectations:
- Neutron first launch: Targeted for second half of 2025
- Revenue growth: Analysts project $599.2 million (37% increase)
- Launch cadence: Targeting 20+ Electron missions
- GEOST integration: Expected closure in second half of 2025
Long-Term Vision
Rocket Lab's strategic vision encompasses becoming a truly end-to-end space company with capabilities spanning:
- Launch services (small and medium-lift)
- Satellite manufacturing and components
- Payload development and integration
- On-orbit services and constellation management
- Space-based data and services
The company's vertical integration strategy positions it to capture value across the entire space mission lifecycle, from initial design through on-orbit operations and data delivery.
Market Opportunities
Government Contracts: The expanding defense space budget and emphasis on commercial partnerships create significant opportunities for sustained revenue growth.
Commercial Constellations: The planned deployment of over 10,000 satellites by 2030 (excluding Starlink and Chinese/Russian constellations) represents substantial launch demand.
Emerging Markets: Direct-to-device connectivity, space-based manufacturing, and lunar economy development offer long-term growth potential.
Investment Considerations
Bull Case
- Proven execution with 68 successful Electron launches
- Strong financial performance with 32% Q1 2025 revenue growth
- Diversified revenue streams reducing single-point risks
- Strategic market positioning in high-growth space economy
- Government relationships providing stable, long-term revenue
- Vertical integration enabling cost advantages and control
Bear Case
- Neutron development risks and potential delays
- SpaceX competitive pressure in medium-lift market
- Capital requirements potentially diluting shareholders
- Technical execution challenges in achieving reusability
- Market saturation risks in small launch segment
Valuation Perspective
At current levels around $38.88, Rocket Lab trades at approximately 7.5x sales, which appears reasonable compared to broader aerospace industry multiples. The company's $17.9 billion market capitalization reflects significant growth expectations that must be validated through successful Neutron deployment and continued market share expansion.
Tickeron: AI-Powered Market Insights for Emerging Tech Trades
As companies like Rocket Lab push the boundaries of aerospace innovation and commercial space access, platforms like Tickeron are helping traders stay ahead of the curve. Tickeron combines real-time market data with machine learning to deliver precision trade ideas, predictive analytics, and adaptive strategies—perfect for navigating volatile, innovation-driven sectors.
Whether tracking aerospace momentum or evaluating high-growth tech plays, Tickeron gives traders an analytical advantage grounded in AI.
Key features include:
- AI Agents (60min / 15min / 5min): Machine-learning agents that generate time-specific trade ideas based on evolving intraday price action.
- AI Pattern Search Engine that identifies technical breakout formations with target levels and statistical confidence.
- Trend Prediction Engine forecasting potential price moves within minutes of the market open.
- Real-Time Signal Screener covering stocks, ETFs, and crypto with live buy/sell signals.
In a market where catalysts—from defense contracts to satellite milestones—can drive rapid price shifts, Tickeron equips traders with the tools to act quickly and confidently.
Conclusion
Rocket Lab's remarkable 164% stock price surge from April to July 2025 reflects fundamental improvements in the company's competitive position, financial performance, and strategic outlook. The combination of major defense contract wins, successful GEOST acquisition, strong operational execution, and favorable industry dynamics has created a compelling investment narrative.
However, investors must carefully weigh the substantial execution risks ahead, particularly regarding Neutron development timelines and the company's ability to compete effectively against SpaceX's established market dominance. The coming months will be critical in determining whether Rocket Lab can successfully transition from a small launch specialist to a comprehensive space solutions provider capable of justifying its current valuation and delivering sustained long-term growth.
RKLB in upward trend: price may jump up because it broke its lower Bollinger Band on June 23, 2026
RKLB may jump back above the lower band and head toward the middle band. Traders may consider buying the stock or exploring call options. In of 29 cases where RKLB's price broke its lower Bollinger Band, its price rose further in the following month. The odds of a continued upward trend are .

Technical Analysis (Indicators)
Bullish Trend Analysis
The RSI Indicator entered the oversold zone -- be on the watch for RKLB's price rising or consolidating in the future. That's also the time to consider buying the stock or exploring call options.
The Stochastic Oscillator shows that the ticker has stayed in the oversold zone for 12 days. The price of this ticker is presumed to bounce back soon, since the longer the ticker stays in the oversold zone, the more promptly an upward trend is expected.
The Moving Average Convergence Divergence (MACD) for RKLB just turned positive on July 06, 2026. Looking at past instances where RKLB's MACD turned positive, the stock continued to rise in of 45 cases over the following month. The odds of a continued upward trend are .
Following a 3-day Advance, the price is estimated to grow further. Considering data from situations where RKLB advanced for three days, in of 298 cases, the price rose further within the following month. The odds of a continued upward trend are .
Bearish Trend Analysis
The Momentum Indicator moved below the 0 level on July 13, 2026. You may want to consider selling the stock, shorting the stock, or exploring put options on RKLB as a result. In of 92 cases where the Momentum Indicator fell below 0, the stock fell further within the subsequent month. The odds of a continued downward trend are .
RKLB moved below its 50-day moving average on June 22, 2026 date and that indicates a change from an upward trend to a downward trend.
The 10-day moving average for RKLB crossed bearishly below the 50-day moving average on June 24, 2026. This indicates that the trend has shifted lower and could be considered a sell signal. In of 10 past instances when the 10-day crossed below the 50-day, the stock continued to move higher over the following month. The odds of a continued downward trend are .
Following a 3-day decline, the stock is projected to fall further. Considering past instances where RKLB declined for three days, the price rose further in of 62 cases within the following month. The odds of a continued downward trend are .
The Aroon Indicator for RKLB entered a downward trend on July 24, 2026. This could indicate a strong downward move is ahead for the stock. Traders may want to consider selling the stock or buying put options.
Fundamental Analysis (Ratings)
The Tickeron Price Growth Rating for this company is (best 1 - 100 worst), indicating fairly steady price growth. RKLB’s price grows at a lower rate over the last 12 months as compared to S&P 500 index constituents.
The Tickeron Profit vs. Risk Rating rating for this company is (best 1 - 100 worst), indicating well-balanced risk and returns. The average Profit vs. Risk Rating rating for the industry is 73, placing this stock slightly better than average.
The Tickeron PE Growth Rating for this company is (best 1 - 100 worst), pointing to average earnings growth. The PE Growth rating is based on a comparative analysis of stock PE ratio increase over the last 12 months compared against S&P 500 index constituents.
The Tickeron Valuation Rating of (best 1 - 100 worst) indicates that the company is slightly overvalued in the industry. This rating compares market capitalization estimated by our proprietary formula with the current market capitalization. This rating is based on the following metrics, as compared to industry averages: P/B Ratio (17.637) is normal, around the industry mean (9.810). P/E Ratio (0.000) is within average values for comparable stocks, (119.202). Projected Growth (PEG Ratio) (0.000) is also within normal values, averaging (4.074). Dividend Yield (0.000) settles around the average of (0.016) among similar stocks. P/S Ratio (52.356) is also within normal values, averaging (34.934).
The Tickeron SMR rating for this company is (best 1 - 100 worst), indicating weak sales and an unprofitable business model. SMR (Sales, Margin, Return on Equity) rating is based on comparative analysis of weighted Sales, Income Margin and Return on Equity values compared against S&P 500 index constituents. The weighted SMR value is a proprietary formula developed by Tickeron and represents an overall profitability measure for a stock.
Notable companies
Industry description
Market Cap
High and low price notable news
Volume
Fundamental Analysis Ratings
The average fundamental analysis ratings, where 1 is best and 100 is worst, are as follows

Advertisement
General Information
Industry AerospaceDefense
Advertisement