


Analysis of Tesla (TSLA) Stock as of June 5, 2025: Market Trends, AI Integration, and TSDD Comparison
Tesla, Inc. (TSLA), a global leader in electric vehicles (EVs) and artificial intelligence (AI)-driven technologies, has been a focal point for investors in 2025. Under the leadership of CEO Elon Musk, Tesla continues to pivot from a traditional EV manufacturer to a powerhouse in autonomous driving and AI innovation. As of June 5, 2025, TSLA’s stock has experienced significant volatility, reflecting broader market dynamics and company-specific developments. This article delves into Tesla’s recent performance, key market news, comparisons with correlated stocks and inverse ETFs, and the role of AI-driven tools like those offered by Tickeron.com.
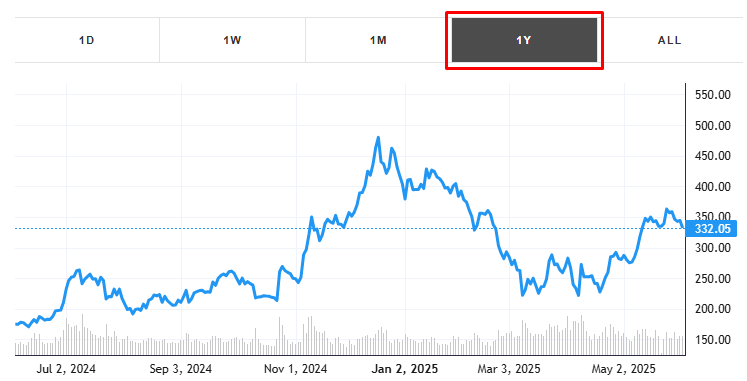
This year, the stock gained +89.99% with an average daily volume of 98 million shares traded. The stock tracked a drawdown of -56.14% for this period. TSLA showed earnings on April 22, 2025. You can read more about the earnings report here.
TSLA Stock Performance and Statistics
Tesla’s stock has shown remarkable resilience in 2025, despite a challenging start. According to recent data, TSLA surged 22% in May 2025, marking its best monthly performance since November 2024. This rally followed a low of $222 per share in March, with the stock rebounding to approximately $363 by late May, as reported by posts on X. However, year-to-date, TSLA remains down over 14% from its all-time high of $479.86 in December 2024, per Dow Jones Market Data Group. The stock’s 50-day moving average crossed bullishly above its 10-day moving average on May 6, 2025, signaling a potential upward trend, according to Tickeron.com.
Key financial metrics from Tesla’s Q1 2025 earnings report highlight a mixed picture: earnings fell 71% year-over-year, with a 13% drop in vehicle deliveries and revenue missing estimates. Despite these setbacks, Tesla’s stock rallied, supported by investor optimism around its autonomous driving initiatives, particularly the anticipated robotaxi launch in June 2025. Posts on X suggest a price target range of $384–$500 by early June, with Wedbush analyst Dan Ives raising his target to $500, citing Tesla’s “golden age of autonomous” nearing with the Austin robotaxi debut.
Key Market News for TSLA on June 5, 2025
Musk’s Return from DOGE and Market Sentiment
Elon Musk’s return to Tesla after his involvement with the Department of Government Efficiency (DOGE) has been a significant catalyst for TSLA’s recent performance. Investors welcomed Musk’s renewed focus, contributing to the 22% stock surge in May. However, his government stint sparked controversy, leading to vandalism against nearly 50% of Tesla owners, according to a study cited by The Cool Down. This backlash, combined with a decline in global sales in Q1 2025, has created a complex narrative for Tesla’s brand.
Autonomous Driving and Robotaxi Developments
Tesla’s advancements in Full Self-Driving (FSD) technology have bolstered investor confidence. A head-to-head test between Tesla and Waymo’s self-driving taxis in San Francisco highlighted Tesla’s competitive edge, with posts on X projecting FSD penetration could exceed 50%, significantly enhancing Tesla’s margins. The upcoming robotaxi launch in Austin is seen as a pivotal moment, potentially driving TSLA toward $509.71, as speculated by some analysts on X.
Trade Policy and Manufacturing Shifts
President Donald Trump’s push for U.S.-based manufacturing, announced on May 30, 2025, has implications for Tesla. The mandate to build vehicles and parts domestically aligns with Tesla’s existing U.S. production facilities, such as its Austin Gigafactory. However, looming tariffs, including a proposed 50% tariff on the European Union starting June 1, 2025, could disrupt Tesla’s European sales, which already face challenges outside Norway, where Model Y deliveries soared over 200% in May.
Comparison with a Highly Correlated Stock: Nvidia (NVDA)
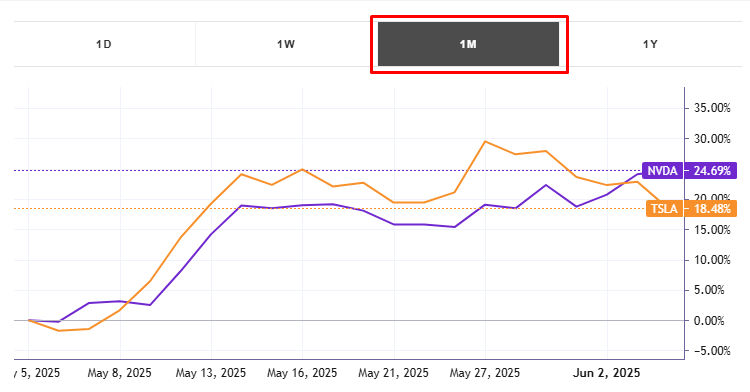
Tesla’s stock often moves in tandem with other tech giants, particularly Nvidia (NVDA), due to their shared focus on AI and innovation. Both companies are part of the “Magnificent Seven” tech stocks, which drove 62% of the S&P 500’s advance in May 2025. Nvidia, like Tesla, posted over 20% gains in May, fueled by its dominance in AI chip production. While Tesla’s market cap hovers around $1.15 trillion as of June 2025, Nvidia’s exceeds $3 trillion, reflecting its broader AI exposure. However, Tesla’s pivot to autonomous driving gives it a unique edge in the mobility sector, whereas Nvidia’s strength lies in data center revenue, which grew nearly 900% from Q4 2023 to Q4 2025. Investors can track Nvidia’s performance on Tickeron.com for further insights.
Price Growth
NVDA (Semiconductors) experienced а +5.27% price change this week, while TSLA (Motor Vehicles) price change was -6.96% for the same time period.
The average weekly price growth across all stocks in the Semiconductors industry was +2.58%. For the same industry, the average monthly price growth was +12.10%, and the average quarterly price growth was +4.27%.
The average weekly price growth across all stocks in the Motor Vehicles industry was +0.31%. For the same industry, the average monthly price growth was +9.79%, and the average quarterly price growth was -2.07%.
Reported Earnings Dates
NVDA is expected to report earnings on Aug 20, 2025.
TSLA is expected to report earnings on Jul 29, 2025.
Industries’ Descriptions
Semiconductors (+2.58% weekly)
The semiconductor industry manufacturers all chip-related products, including research and development. These chips are used in innumerable electronic devices, including computers, cell phones, smartphones, and GPSs. Intel Corporation, NVIDIA Corp., and Broadcom are some of the prominent players in this industry. Semiconductor companies usually tend to do well during periods of healthy economic growth, thereby inducing further research and development in the industry, which in turn augurs well for productivity and growth in the economy. In the near future, demand for semiconductor products (and possibly innovation within the segment) should only expand further, with the proliferation of 5G, autonomous vehicles, IoT, and various AI-driven electronics set to herald a new, advanced chapter in the technology-driven world as we know it. With burgeoning prospects comes great competition. In 2015, SIA estimated that the U.S. semiconductor industry ranks as the second most competitive U.S. industry out of 2882 U.S. industries designated manufacturers by the U.S. Census Bureau.
Motor Vehicles (+0.31% weekly)
Automobiles continue to be arguably the most popular form of passenger travel in the U.S., and major automobile makers have revenues and market capitalizations running into the multi-billions. In recent years, the industry has been experiencing some path-breaking innovations like electric vehicles and self-driving technology. While there are long-standing companies like General Motors, Ford, and Toyota Motors operating in this space, there are also emerging/rapidly growing players like Tesla, which has had a major role in the growing popularity of the electric vehicle market. With technological advancements taking steam in the auto space, we’ve also witnessed collaborations (or talks of potential partnerships) of carmakers with tech behemoths like Google’s subsidiary, Waymo.
TSLA vs. TSDD: Understanding the Inverse ETF
The Direxion Daily TSLA Bear 1X Shares (TSDD) is an inverse exchange-traded fund (ETF) designed to provide daily investment results that correspond to the inverse (-1x) of Tesla’s daily stock performance. As TSLA rallied 22% in May, TSDD experienced a corresponding decline, reflecting its bearish stance. According to Tickeron.com, TSDD is non-diversified and primarily uses financial instruments like swap agreements to achieve its inverse exposure to TSLA. For instance, a 3% daily gain in TSLA would theoretically result in a 3% loss for TSDD, before fees and expenses.
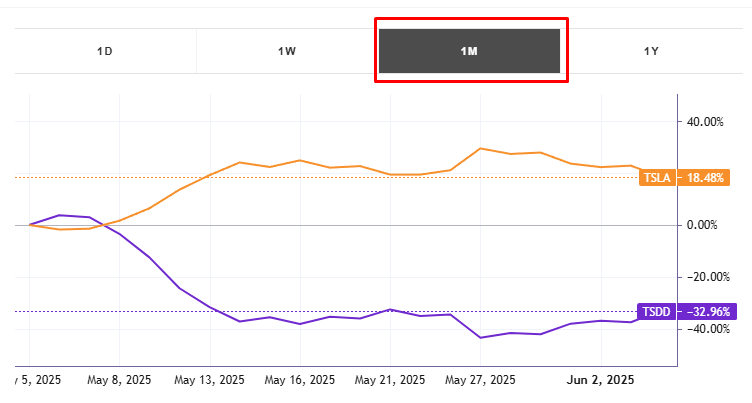
TSDD is a high-risk instrument suited for short-term traders betting against Tesla’s performance. Its average monthly price growth was -77% in May, mirroring TSLA’s strong upward movement. Investors considering TSDD should be cautious of its volatility and leverage, as prolonged TSLA rallies can lead to significant losses. For detailed analysis, visit Tickeron.com.
Tickeron’s AI-driven tools, including its Financial Learning Models (FLMs) and trading bots, are revolutionizing how investors approach stocks like TSLA. Led by CEO Sergey Savastiouk, Tickeron offers user-friendly trading bots for beginners, high-liquidity stock robots, and real-time AI insights via platforms like the Double Agents, which provide both bullish and bearish signals. These tools are particularly valuable for analyzing volatile stocks like TSLA, enabling traders to identify patterns with precision. For example, Tickeron’s AI can detect breakout signals, such as TSLA’s move above its 50-day moving average on May 2, 2025. Explore these capabilities at Tickeron.com’s Virtual Agents.
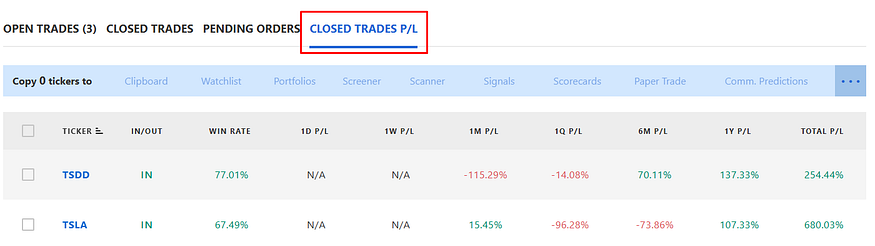
TSLA / TSDD Trading Results AI Trading Double Agent +107.64%
Conclusion and Outlook
Tesla’s stock trajectory in 2025 reflects a blend of challenges and opportunities. While Q1 financials were lackluster, the market’s optimism about Tesla’s AI and autonomous driving prospects, coupled with Musk’s return, has fueled a robust recovery. The inverse ETF TSDD offers a counterplay for bearish investors but carries significant risks. As Tesla navigates trade policy shifts and expands its FSD technology, tools like Tickeron’s AI Trading Bots can provide critical insights for informed decision-making. For the latest updates and analytics, visit Tickeron.com.
TSLA in +1.72% Uptrend, growing for three consecutive days on November 17, 2025
Moving higher for three straight days is viewed as a bullish sign. Keep an eye on this stock for future growth. Considering data from situations where TSLA advanced for three days, in of 338 cases, the price rose further within the following month. The odds of a continued upward trend are .

Technical Analysis (Indicators)
Bullish Trend Analysis
The Stochastic Oscillator shows that the ticker has stayed in the oversold zone for 7 days. The price of this ticker is presumed to bounce back soon, since the longer the ticker stays in the oversold zone, the more promptly an upward trend is expected.
TSLA may jump back above the lower band and head toward the middle band. Traders may consider buying the stock or exploring call options.
The Aroon Indicator entered an Uptrend today. In of 280 cases where TSLA Aroon's Indicator entered an Uptrend, the price rose further within the following month. The odds of a continued Uptrend are .
Bearish Trend Analysis
The Momentum Indicator moved below the 0 level on November 06, 2025. You may want to consider selling the stock, shorting the stock, or exploring put options on TSLA as a result. In of 79 cases where the Momentum Indicator fell below 0, the stock fell further within the subsequent month. The odds of a continued downward trend are .
The Moving Average Convergence Divergence Histogram (MACD) for TSLA turned negative on November 04, 2025. This could be a sign that the stock is set to turn lower in the coming weeks. Traders may want to sell the stock or buy put options. Tickeron's A.I.dvisor looked at 45 similar instances when the indicator turned negative. In of the 45 cases the stock turned lower in the days that followed. This puts the odds of success at .
TSLA moved below its 50-day moving average on November 13, 2025 date and that indicates a change from an upward trend to a downward trend.
The 10-day moving average for TSLA crossed bearishly below the 50-day moving average on November 18, 2025. This indicates that the trend has shifted lower and could be considered a sell signal. In of 15 past instances when the 10-day crossed below the 50-day, the stock continued to move higher over the following month. The odds of a continued downward trend are .
Following a 3-day decline, the stock is projected to fall further. Considering past instances where TSLA declined for three days, the price rose further in of 62 cases within the following month. The odds of a continued downward trend are .
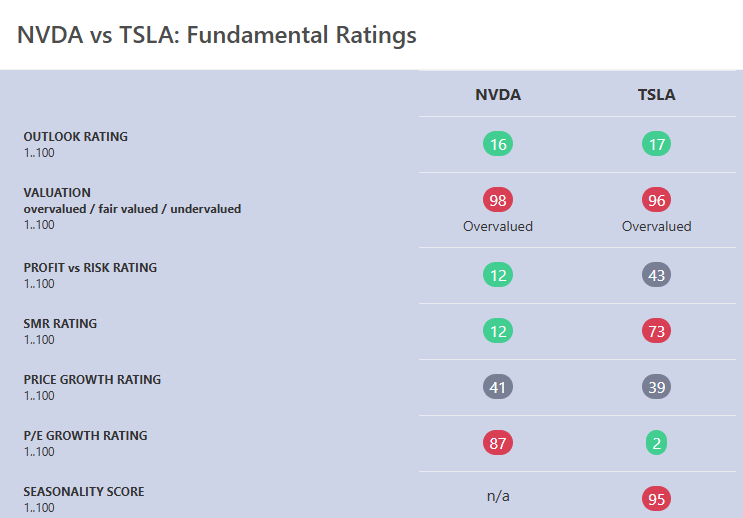
The Tickeron PE Growth Rating for this company is (best 1 - 100 worst), pointing to outstanding earnings growth. The PE Growth rating is based on a comparative analysis of stock PE ratio increase over the last 12 months compared against S&P 500 index constituents.
The Tickeron Profit vs. Risk Rating rating for this company is (best 1 - 100 worst), indicating well-balanced risk and returns. The average Profit vs. Risk Rating rating for the industry is 83, placing this stock slightly better than average.
The Tickeron Seasonality Score of (best 1 - 100 worst) indicates that the company is fair valued in the industry. The Tickeron Seasonality score describes the variance of predictable price changes around the same period every calendar year. These changes can be tied to a specific month, quarter, holiday or vacation period, as well as a meteorological or growing season.
The Tickeron Price Growth Rating for this company is (best 1 - 100 worst), indicating steady price growth. TSLA’s price grows at a higher rate over the last 12 months as compared to S&P 500 index constituents.
The Tickeron SMR rating for this company is (best 1 - 100 worst), indicating weak sales and an unprofitable business model. SMR (Sales, Margin, Return on Equity) rating is based on comparative analysis of weighted Sales, Income Margin and Return on Equity values compared against S&P 500 index constituents. The weighted SMR value is a proprietary formula developed by Tickeron and represents an overall profitability measure for a stock.
The Tickeron Valuation Rating of (best 1 - 100 worst) indicates that the company is significantly overvalued in the industry. This rating compares market capitalization estimated by our proprietary formula with the current market capitalization. This rating is based on the following metrics, as compared to industry averages: P/B Ratio (17.361) is normal, around the industry mean (3.712). P/E Ratio (288.124) is within average values for comparable stocks, (269.614). TSLA's Projected Growth (PEG Ratio) (8.290) is very high in comparison to the industry average of (2.115). TSLA has a moderately low Dividend Yield (0.000) as compared to the industry average of (0.043). P/S Ratio (15.385) is also within normal values, averaging (25.129).
Notable companies
Industry description
Market Cap
High and low price notable news
Volume
Fundamental Analysis Ratings
The average fundamental analysis ratings, where 1 is best and 100 is worst, are as follows

Advertisement
General Information
a manufacturer of electric sports cars
Industry MotorVehicles
Advertisement