


CoreWeave Inc. (CRWV): The AI Infrastructure Success Story: An Amazing Increase from $33 to $155
CoreWeave Inc. (CRWV) has delivered one of the most spectacular stock performances of 2025, surging approximately 365% from its April 21 low of $33.52 to the current price of $155.94 as of July 2, 2025. Since going public on March 28, 2025, at $40 per share, the AI cloud infrastructure company has become a poster child for the artificial intelligence boom, despite facing significant volatility and skepticism from Wall Street analysts.
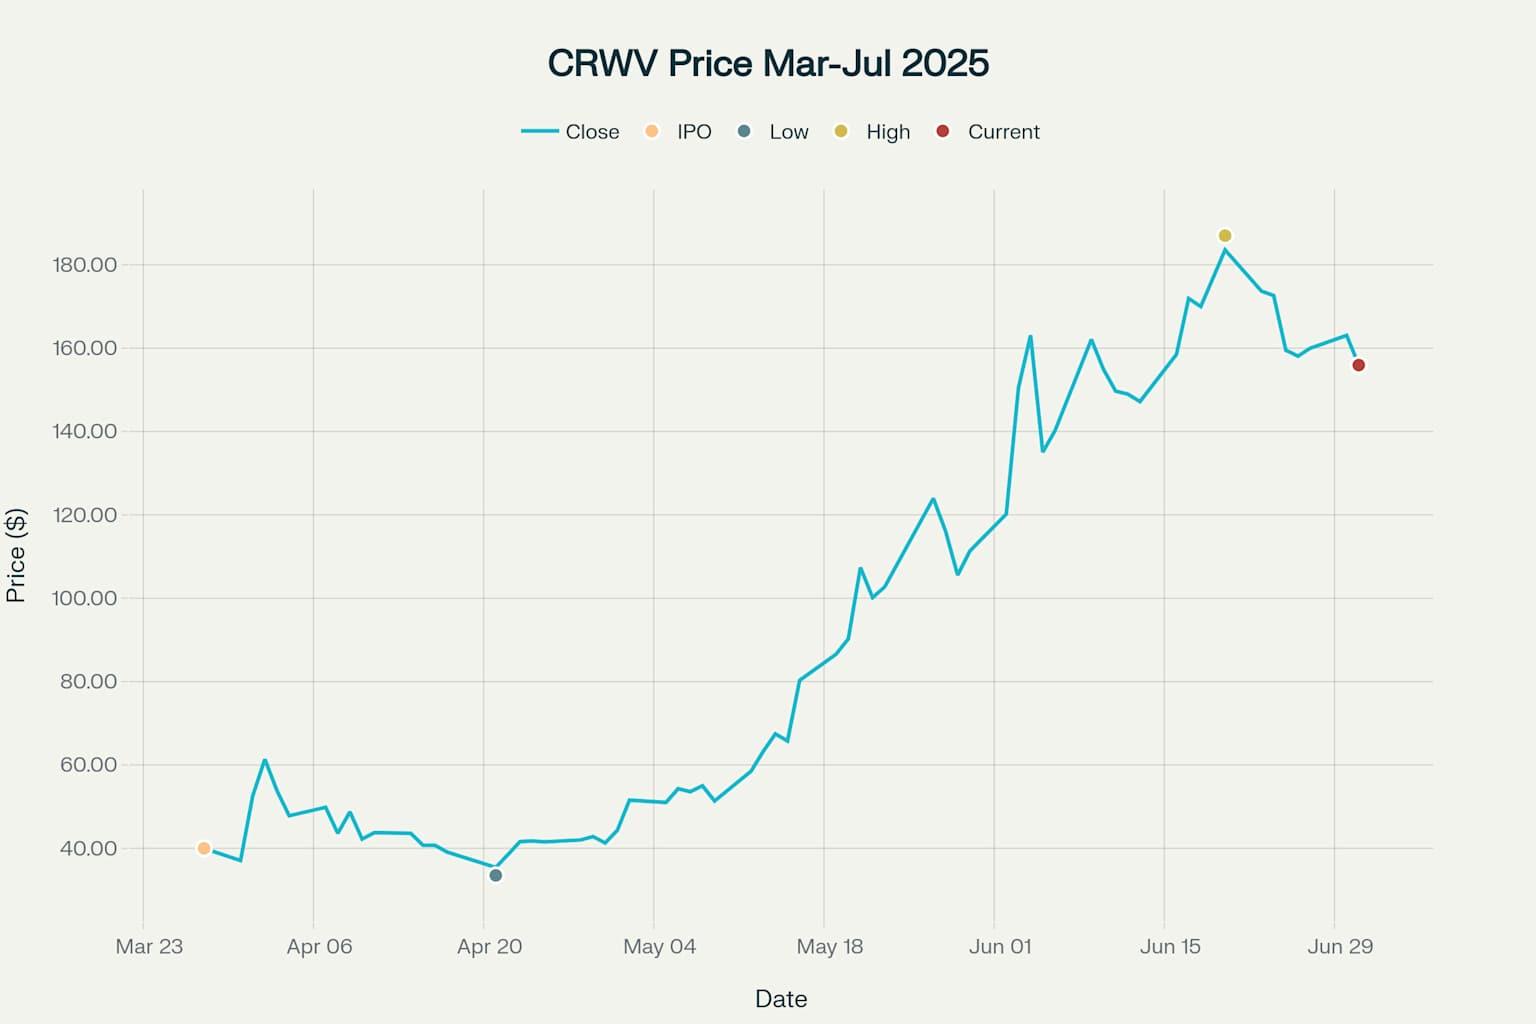
CoreWeave (CRWV) Stock Price Performance: March 28 - July 2, 2025
Company Overview: The AI Hyperscaler™
What is CoreWeave?
CoreWeave Inc. is a specialized AI cloud computing company headquartered in Livingston, New Jersey, that has positioned itself as the "AI Hyperscaler™". Founded in September 2017 as a cryptocurrency mining operation, the company pivoted to AI infrastructure in 2020, recognizing the explosive demand for GPU-powered cloud services.
Business Model and Services
CoreWeave operates a purpose-built cloud platform optimized specifically for AI workloads, differentiating itself from traditional cloud providers like AWS, Microsoft Azure, and Google Cloud that were originally designed for web-scale applications. The company's CoreWeave Cloud Platform consists of:
- Specialized GPU Infrastructure: Over 250,000 NVIDIA GPUs across 32 data centers as of December 2024
- AI-Optimized Software: Proprietary software and cloud services designed for complex AI infrastructure management
- Take-or-Pay Contracts: Long-term committed contracts typically spanning 2-5 years, providing highly predictable revenue streams
- On-Demand Services: Pay-as-you-go options for flexible workload management
Revenue Model: CoreWeave generates revenue by selling access to its AI infrastructure through a per-GPU-per-hour pricing model, with storage sold separately on a per-gigabyte-per-month basis.
The IPO Journey: From Modest Beginnings to Market Darling
IPO Launch Details
CoreWeave went public on March 28, 2025, in what became the largest U.S. venture-backed tech IPO since 2021. However, the debut was initially lukewarm:
- Initial Price Range: $47-$55 per share
- Final IPO Price: $40 per share (significantly below expectations)
- Shares Offered: 37.5 million shares
- Gross Proceeds: Approximately $1.5 billion
The company's IPO was anchored by NVIDIA, which purchased $250 million worth of shares at the $40 price point, demonstrating strong strategic partnership support.
Initial Market Reception
The stock's debut on March 28 was notably flat, closing unchanged at $40. This tepid response occurred during challenging market conditions, with the Nasdaq falling 2.7% that day and concerns about tariffs and inflation weighing on tech stocks.
The Dramatic Recovery: Key Catalysts Behind the 365% Surge
Q1 2025 Financial Performance: Revenue Explosion
CoreWeave's transformation accelerated dramatically in Q1 2025, with the company reporting record-breaking financial results:
- Revenue: $981.6 million (420% year-over-year increase)
- Adjusted EBITDA: $606.1 million (480% year-over-year increase)
- Revenue Backlog: $25.9 billion as of March 31, 2025
This explosive growth was driven by accelerating demand for AI infrastructure from major clients including Microsoft, OpenAI, Meta, and NVIDIA.
Strategic Partnerships and Major Contracts
The $11.9 Billion OpenAI Deal
The most significant catalyst for CoreWeave's stock surge was the announcement of a five-year, $11.9 billion strategic agreement with OpenAI in March 2025. This landmark deal:
- Provides OpenAI with dedicated compute capacity for training and deploying AI models
- Includes OpenAI receiving $350 million in CoreWeave equity through a private placement
- Helps diversify CoreWeave's customer base beyond its heavy dependence on Microsoft
Microsoft Relationship Evolution
While Microsoft accounted for 62% of CoreWeave's revenue in 2024 ($1.2 billion), the relationship has evolved strategically:
- Microsoft announced plans to spend around $10 billion on CoreWeave services through the end of the decade
- Despite reports of some contract adjustments, both companies denied any major cancellations
- The relationship remains crucial, with Microsoft representing less than 50% of future committed contract revenues when combining existing and new deals
NVIDIA's Strategic Investment
NVIDIA's involvement has been instrumental in CoreWeave's success:
- 24.2 million shares owned as of March 2025, worth nearly $900 million at that time
- Current stake value estimated at over $1.6 billion given the stock's appreciation
- Provides CoreWeave with early access to cutting-edge GPU technology, including the latest Blackwell chips
Major Strategic Acquisitions and Expansions
Weights & Biases Acquisition
In May 2025, CoreWeave completed the $1.7 billion acquisition of Weights & Biases, a leading AI developer platform. This strategic move:
- Brings over 1,400 AI labs and enterprises into CoreWeave's ecosystem
- Creates a comprehensive AI Cloud Platform combining infrastructure and development tools
- Expands CoreWeave's capabilities beyond pure infrastructure into AI application development
Massive Data Center Expansion
CoreWeave has embarked on an aggressive expansion strategy:
- $7 billion, 15-year lease agreements with Applied Digital for 250MW of capacity in North Dakota
- 13MW deployment at Flexential's Dallas-Plano facility
- Expansion from 3 data centers in 2022 to 32 data centers by end of 2024
Financial Engineering and Capital Structure
$2 Billion Senior Notes Offering
In May 2025, CoreWeave issued $2 billion in 9.25% senior notes due 2030, significantly larger than the initially planned $1.5 billion. This financing:
- Provides capital for general corporate purposes and debt repayment
- Demonstrates strong investor confidence in the company's growth trajectory
- Strengthens the balance sheet for continued expansion
Credit Facility Enhancement
CoreWeave also expanded its revolving credit facility from $650 million to $1.5 billion in May 2025, with the maturity extended to May 2028.
Market Dynamics and Competitive Positioning
AI Infrastructure Market Growth
CoreWeave operates in a rapidly expanding market:
- AI infrastructure market projected to reach $74.06 billion in 2025, growing at 30% CAGR
- GPU cloud computing market expected to reach $47.24 billion by 2033, with 35% CAGR
- Rising demand driven by generative AI adoption across industries
Competitive Advantages
CoreWeave has established several key differentiators:
- Purpose-built AI infrastructure optimized from the ground up for AI workloads
- 20-50% cost advantage over traditional cloud providers like AWS, Azure, and Google Cloud for GPU workloads
- Early access to NVIDIA technology through strategic partnership
- Specialized expertise in high-performance AI computing
Competitive Challenges
Despite its advantages, CoreWeave faces significant competitive pressures:
- Resource disparity compared to hyperscale cloud providers (AWS, Microsoft Azure, Google Cloud)
- NVIDIA's own cloud ambitions through DGX Cloud potentially competing with partners
- Traditional cloud providers expanding their AI-specific offerings
Stock Performance Analysis and Market Dynamics
Volatility and High Beta Characteristics
CoreWeave stock has exhibited extreme volatility since its IPO:
- 250% gain from IPO to June 2025 peak
- All-time high of $187 reached in June 2025
- Daily swings of 20%+ common during major announcements
Analyst Sentiment and Price Targets
Wall Street analysts remain cautiously optimistic but concerned about valuation:
- Average price target: $65-$83 (significant downside from current levels)
- Consensus rating: Hold, with mixed buy/sell recommendations
- Highest price target: $185 (Bank of America)
- Concerns: High valuation, customer concentration, profitability timeline
Retail vs. Institutional Investor Dynamics
The stock's performance appears driven by divergent investor sentiment:
- Retail investors attracted to AI growth story and momentum
- Institutional investors more cautious about fundamentals and valuation
- Short interest significantly elevated, creating potential for continued squeezes
Financial Health and Risk Factors
Profitability Challenges
Despite explosive revenue growth, CoreWeave faces near-term profitability pressures:
- Net loss per share: $1.49 in Q1 2025 (widened from prior year)
- $177 million stock-based compensation expense related to IPO
- High operating expenses due to rapid scaling investments
Balance Sheet Considerations
- Revenue backlog: $25.9 billion provides strong future visibility
- Debt-to-equity ratio: 38.7%, elevated but manageable given growth prospects
- Cash position: Strengthened by IPO proceeds and debt financing
Key Risk Factors
- Customer concentration: Heavy dependence on Microsoft and a few large clients
- Capital intensity: Massive infrastructure investments required for growth
- Competition: Threat from well-resourced hyperscale cloud providers
- Technology dependence: Reliance on NVIDIA GPU supply and technology roadmap
Future Outlook and Strategic Direction
Revenue Projections and Growth Trajectory
Management has provided optimistic forward guidance:
- 2025 revenue guidance: $4.9-$5.1 billion
- Q2 2025 guidance: $1.06-$1.1 billion
- Long-term potential: Some analysts project $301 billion market cap by 2028 in bull case scenarios
Strategic Initiatives and Market Expansion
CoreWeave's future strategy focuses on several key areas:
- Platform Expansion: Leveraging Weights & Biases acquisition to offer end-to-end AI development solutions
- Geographic Growth: Expanding European operations and exploring new markets
- Customer Diversification: Reducing dependence on any single client through broader market penetration
- Technology Leadership: Maintaining edge through continued NVIDIA partnership and early access to new architectures
Market Position in 2026 and Beyond
Several scenarios could unfold for CoreWeave:
Bull Case: If AI adoption accelerates as projected and CoreWeave maintains its technological edge, the company could capture significant market share in the $100+ billion AI infrastructure market.
Base Case: Continued strong growth but with increased competition and margin pressure as traditional cloud providers enhance their AI offerings.
Bear Case: Intensifying competition from well-resourced hyperscalers and potential economic slowdown could pressure growth and profitability.
Tickeron: AI-Powered Insights for Traders in Tech-Driven Markets
As companies like CoreWeave lead the charge in reshaping the AI infrastructure landscape, platforms such as Tickeron are equipping traders and investors with powerful AI tools to identify and act on similar innovation-driven opportunities in the market. Designed to decode complex price action, Tickeron uses machine learning to generate high-confidence trade ideas and predictive analytics across equities, ETFs, crypto, and more.
Built for both short-term and trend-based strategies, Tickeron blends financial data with artificial intelligence to support informed decisions in fast-evolving tech sectors.
Key features include:
- AI Agents (60min / 15min / 5min): Short-term machine learning agents that generate intraday trade ideas with precise entry and exit logic.
- AI Pattern Search Engine that identifies breakout setups and classic chart patterns with confidence levels and targets.
- Trend Prediction Engine offering projected entry/exit points shortly after market open.
- Real-Time Signal Screener that tracks buy/sell signals across thousands of instruments based on live market data
In markets shaped by innovation and volatility—like the one surrounding CoreWeave—Tickeron helps traders stay adaptive, data-driven, and ahead of the curve.
Conclusion: A High-Stakes AI Infrastructure Play
CoreWeave's spectacular 365% gain from its April 2025 low represents one of the most remarkable recovery stories in recent IPO history. The company has successfully positioned itself at the center of the AI revolution, leveraging strategic partnerships with NVIDIA and OpenAI to build a formidable AI-first cloud platform.
Key Success Factors:
- Strategic Partnerships: Strong relationships with NVIDIA and major AI companies
- Market Timing: Positioned perfectly for the AI infrastructure boom
- Specialized Focus: Purpose-built infrastructure optimized for AI workloads
- Financial Execution: Strong revenue growth and successful capital raising
Investment Considerations:
For growth-oriented investors, CoreWeave represents a compelling play on the AI infrastructure theme, with significant upside potential if the company can execute its expansion plans and maintain its technological edge.
For value-conscious investors, the current valuation appears stretched relative to near-term fundamentals, suggesting patience may be rewarded with better entry points.
Risk-Reward Profile: CoreWeave embodies the classic high-growth, high-risk technology investment. While the company's positioning in the AI ecosystem is enviable, investors must weigh the substantial execution risks, competitive pressures, and valuation concerns against the enormous market opportunity.
The next 12-18 months will be critical for CoreWeave as it demonstrates its ability to diversify its customer base, achieve sustainable profitability, and maintain its competitive position against increasingly aggressive competition from hyperscale cloud providers. The company's success or failure in these areas will likely determine whether the current stock price represents the early stages of a long-term winner or an overvalued momentum play that has run ahead of fundamentals.
Contributor
Financial writer and active order flow futures trader with a focus on fundamental analysis, macroeconomic factors, and equity research. I make in-depth blogs on stocks and ETFs, bridging the gap between raw market data and real-world trading decisions.
CRWV's MACD Histogram just turned positive
The Moving Average Convergence Divergence (MACD) for CRWV turned positive on September 24, 2026. Looking at past instances where CRWV's MACD turned positive, the stock continued to rise in 14 of 14 cases over the following month. The odds of a continued upward trend are 90%.

Technical Analysis (Indicators)
Bullish Trend Analysis
The Momentum Indicator moved above the 0 level on September 28, 2026. You may want to consider a long position or call options on CRWV as a result. In 17 of 20 past instances where the momentum indicator moved above 0, the stock continued to climb. The odds of a continued upward trend are 85%.
CRWV moved above its 50-day moving average on September 30, 2026 date and that indicates a change from a downward trend to an upward trend.
The 10-day moving average for CRWV crossed bullishly above the 50-day moving average on October 02, 2026. This indicates that the trend has shifted higher and could be considered a buy signal. In 3 of 4 past instances when the 10-day crossed above the 50-day, the stock continued to move higher over the following month. The odds of a continued upward trend are 75%.
Following a +2.87% 3-day Advance, the price is estimated to grow further. Considering data from situations where CRWV advanced for three days, in 76 of 82 cases, the price rose further within the following month. The odds of a continued upward trend are 90%.
Bearish Trend Analysis
The Stochastic Oscillator may be shifting from an upward trend to a downward trend. In 19 of 20 cases where CRWV's Stochastic Oscillator exited the overbought zone, the price fell further within the following month. The odds of a continued downward trend are 90%.
Following a 3-day decline, the stock is projected to fall further. Considering past instances where CRWV declined for three days, the price rose further in 50 of 62 cases within the following month. The odds of a continued downward trend are 90%.
CRWV broke above its upper Bollinger Band on September 08, 2026. This could be a sign that the stock is set to drop as the stock moves back below the upper band and toward the middle band. You may want to consider selling the stock or exploring put options.
The Aroon Indicator for CRWV entered a downward trend on September 22, 2026. This could indicate a strong downward move is ahead for the stock. Traders may want to consider selling the stock or buying put options.
Fundamental Analysis (Ratings)
The Tickeron Valuation Rating of 38 (best 1 - 100 worst) indicates that the company is fair valued in the industry. This rating compares market capitalization estimated by our proprietary formula with the current market capitalization. This rating is based on the following metrics, as compared to industry averages: P/B Ratio (9.337) is normal, around the industry mean (17.861). P/E Ratio (0.000) is within average values for comparable stocks, (159.605). Projected Growth (PEG Ratio) (0.000) is also within normal values, averaging (3.648). Dividend Yield (0.000) settles around the average of (0.004) among similar stocks. P/S Ratio (5.721) is also within normal values, averaging (104.490).
The Tickeron Price Growth Rating for this company is 58 (best 1 - 100 worst), indicating fairly steady price growth. CRWV’s price grows at a lower rate over the last 12 months as compared to S&P 500 index constituents.
The Tickeron SMR rating for this company is 98 (best 1 - 100 worst), indicating weak sales and an unprofitable business model. SMR (Sales, Margin, Return on Equity) rating is based on comparative analysis of weighted Sales, Income Margin and Return on Equity values compared against S&P 500 index constituents. The weighted SMR value is a proprietary formula developed by Tickeron and represents an overall profitability measure for a stock.
The Tickeron PE Growth Rating for this company is 100 (best 1 - 100 worst), pointing to worse than average earnings growth. The PE Growth rating is based on a comparative analysis of stock PE ratio increase over the last 12 months compared against S&P 500 index constituents.
The Tickeron Profit vs. Risk Rating rating for this company is 100 (best 1 - 100 worst), indicating that the returns do not compensate for the risks. CRWV’s unstable profits reported over time resulted in significant Drawdowns within these last five years. A stable profit reduces stock drawdown and volatility. The average Profit vs. Risk Rating rating for the industry is 91, placing this stock worse than average.
Notable companies
Industry description
Market Cap
High and low price notable news
Volume
Fundamental Analysis Ratings
The average fundamental analysis ratings, where 1 is best and 100 is worst, are as follows

Advertisement
General Information
Industry ComputerCommunications
Advertisement