


From 35% to 198%: The Power of Shorter ML Timeframes in AI Trading
As artificial intelligence continues to reshape the financial markets, one thing is becoming clear: speed and adaptability win. Tickeron’s evolution of its proprietary Financial Learning Models (FLMs)—which integrate AI and machine learning into algorithmic trading—offers a compelling case for the advantages of shorter machine learning (ML) time frames and strategic use of inverse ETFs.
The evidence? A staggering jump in performance—from 35% to 198% annualized return—when comparing two of Tickeron’s AI trading agents: one using 60-minute ML intervals and the other operating on 15-minute ML cycles with expanded hedging strategies.
AI Agent #1: 15-Minute ML with Top 5 Companies + Inverse ETFs
Annualized Return: 198%
9-Ticker AI Agent (15 min)
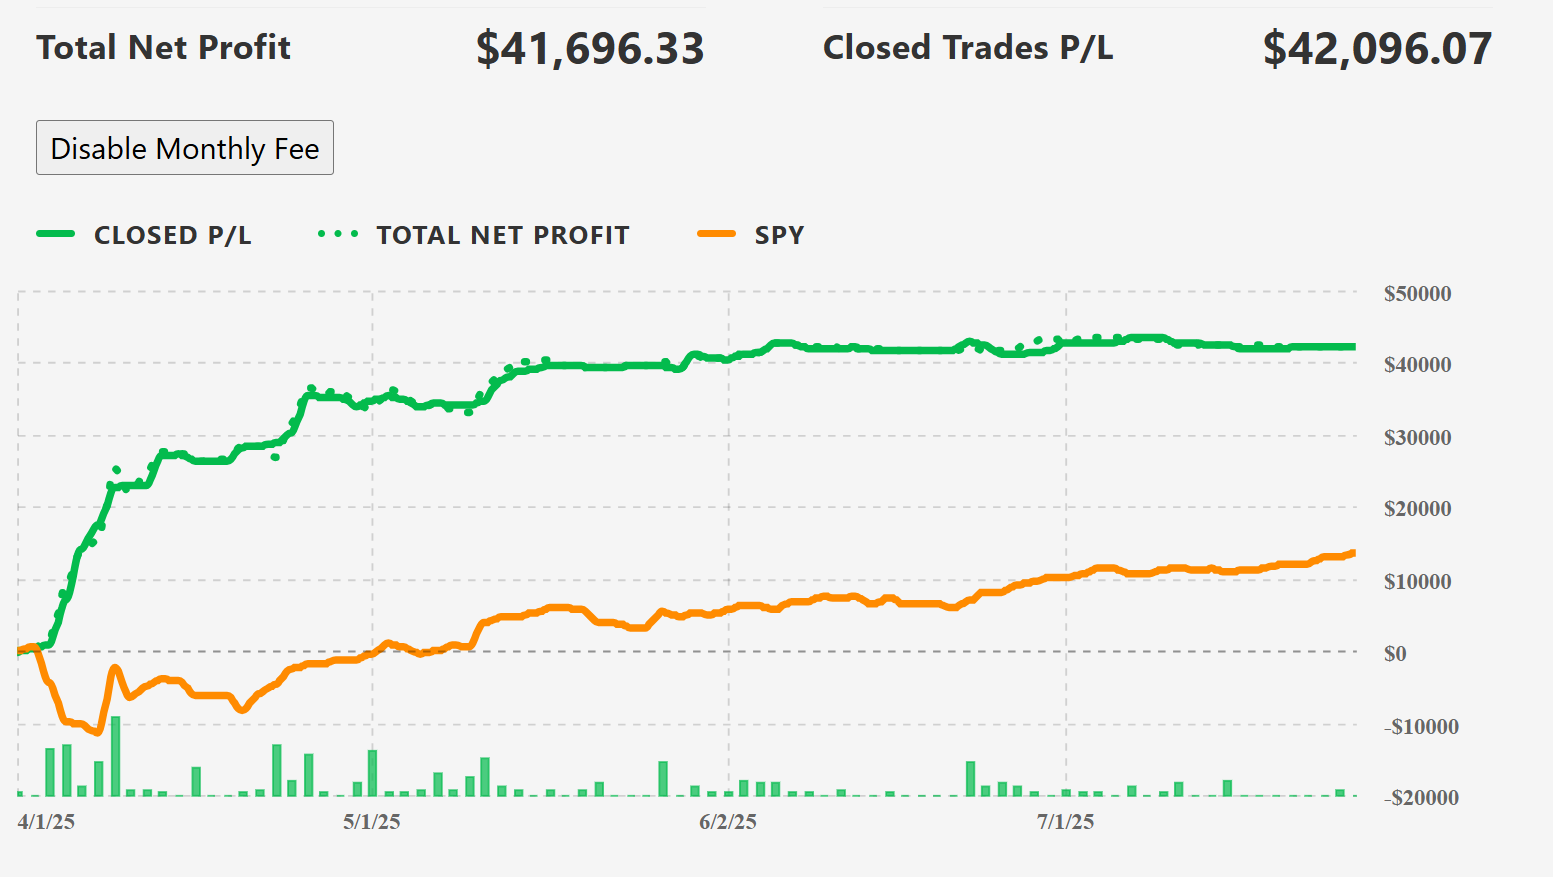
In contrast to its predecessor, this high-frequency trading agent operates across nine tickers, including five mega-cap tech stocks—AAPL, GOOG, NVDA, TSLA, and MSFT—and four leveraged ETFs: SOXL, SOXS, QID, and QLD. The strategy leverages 15-minute ML cycles, offering rapid entry/exit signals and the ability to trade both long and short positions.
Buy Long & Hedge Short
The inclusion of inverse ETFs provides robust hedging capability and enables profitability in down markets, something long-only strategies struggle with.
Strategic Features
- Breakout Acceleration Engine: Identifies volume-driven price breakouts
- High-Frequency Execution: Places multiple trades per session
- Micro-Floating Stop-Loss System: Tight risk control without premature exits
- Dynamic Profit Capture: Targets gains of +4% to +7% per trade
- Volatility Optimization: Focuses on earnings events, macro news, and high-beta stocks
This AI bot is designed for active, momentum-based intraday traders, not passive investors. It thrives in environments characterized by fast-moving news cycles, volatile sentiment, and sharp directional shifts.
AI Agent #2: 60-Minute ML with Top 10 Companies
Annualized Return: 35%
Swing Trader: Top 10 Giants (60 min)
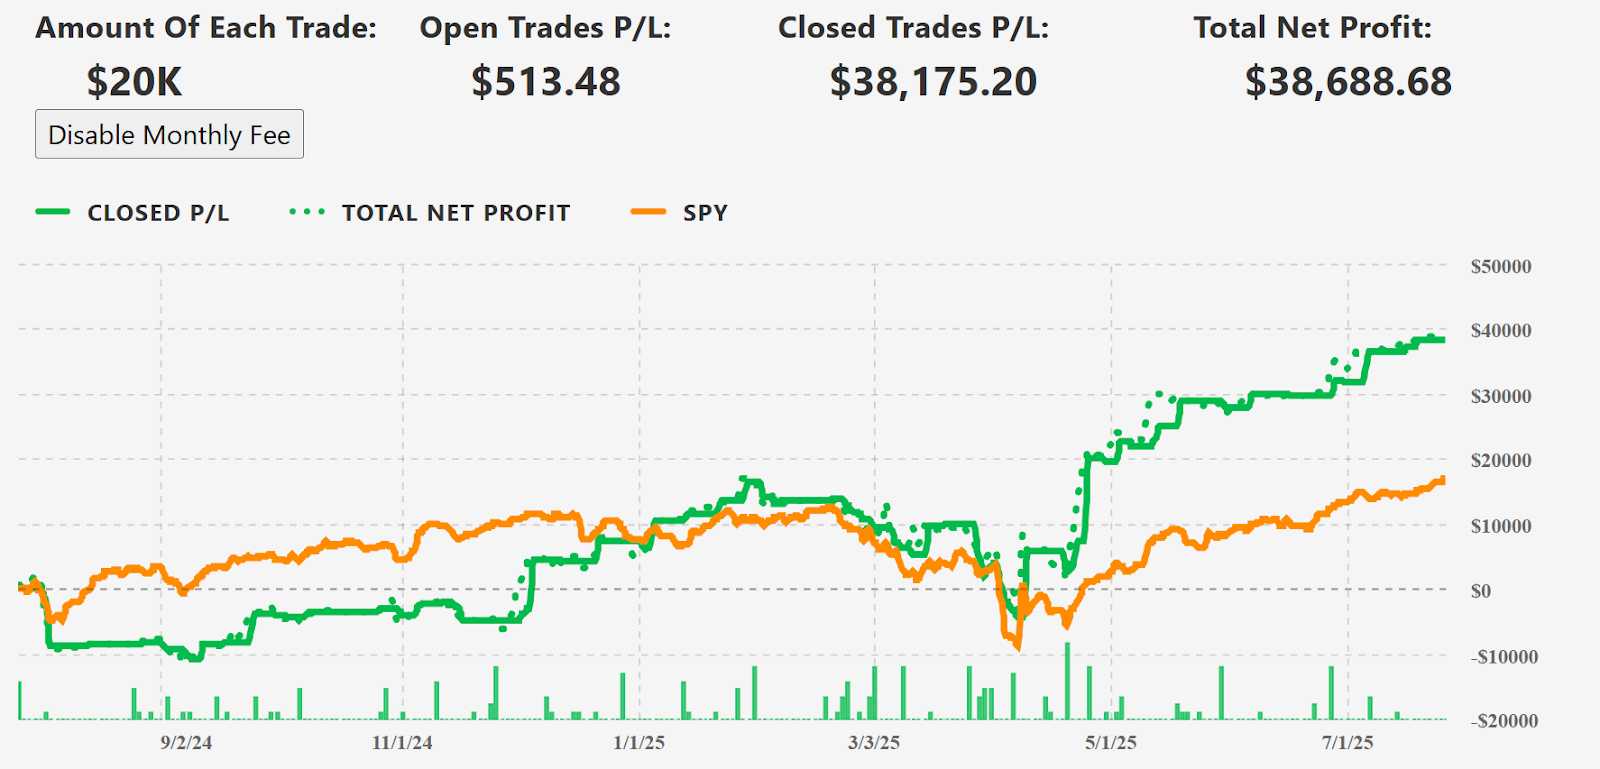
This agent is designed for traders seeking long-only exposure to the top 10 S&P 500 companies by market cap, such as Apple, Microsoft, and Alphabet. It provides a stable, large-cap focused strategy using Tickeron’s 60-minute ML timeframes.
Overview and Suitability
Built for traders of all experience levels, this AI agent navigates the financial markets like a seasoned sailor steering through well-known currents. By focusing on market giants, it minimizes volatility and maximizes stability. Ideal for long-only investors, it avoids frequent trading and targets mean-reversion opportunities—entering positions shortly before market close after a confirmed dip and rebound signal.
Technical Design
The bot uses a blend of hourly (H1) and four-hour (H4) charts, while incorporating daily timeframe filters to validate trend signals. It identifies optimal pullback entries during intraday sell-offs, positioning itself to ride the recovery phase. The trading logic executes conservatively, managing up to six positions at a time.
While the 60-minute ML model performs reliably in calmer markets, its slower cycle means it often misses shorter bursts of volatility or abrupt market reversals. This is where the 15-minute model shines.
Why 15-Minute Time Frames Outperform
The key advantage of the 15-minute ML model is speed and granularity. It allows the AI to process and respond to market changes more frequently, capturing opportunities that longer intervals miss. While the 60-minute model might catch one or two trades a day, the 15-minute model can execute multiple high-probability trades during a single market session.
Benefits of Shorter ML Time Frames
- Faster Reaction Time to market swings
- Greater entry precision, improving risk/reward ratios
- More frequent signals, increasing opportunity volume
- Adaptive learning, responding to real-time volatility
- Better hedging integration, through inverse ETF strategies
By trading both sides of the market and using more granular signals, the 15-minute agent demonstrates higher capital efficiency and stronger return potential.
The Role of Tickeron’s Financial Learning Models (FLMs)
At the core of both agents are Tickeron’s FLMs—sophisticated algorithms trained on massive financial datasets. These models are engineered to:
- Detect patterns invisible to the human eye
- Continuously adapt through machine learning
- Validate trades using multi-timeframe signals
- Integrate technical indicators with real-time sentiment
The 15-minute FLMs take these capabilities to the next level, providing higher-frequency insights, which are critical in today’s fast-paced trading environment.
Performance Summary
Feature
60-Minute Agent (Top 10)
15-Minute Agent (Top 5 + ETFs)
Annualized Return
35%
198%
Timeframe
60 minutes
15 minutes
Instruments
Top 10 S&P 500 stocks
Top 5 Tech + Leveraged ETFs
Trade Frequency
Low
High
Hedge Capabilities
None
Yes (via inverse ETFs)
Volatility Suitability
Medium
High
Max Positions
6
10
Conclusion: The Future Belongs to Faster, Smarter AI
Tickeron’s 15-minute ML strategy proves that shorter learning cycles, strategic diversification, and AI-driven hedging are not just theoretical improvements—they deliver real performance gains. With an annualized return of 198%, this next-generation agent significantly outpaces its 60-minute counterpart.
For traders seeking higher returns, smarter risk controls, and dynamic exposure to both bullish and bearish trends, 15-minute ML AI agents are the future.
Explore AI Agents today at Tickeron.com
AAPL in upward trend: price may jump up because it broke its lower Bollinger Band on June 25, 2026
AAPL may jump back above the lower band and head toward the middle band. Traders may consider buying the stock or exploring call options. In of 27 cases where AAPL's price broke its lower Bollinger Band, its price rose further in the following month. The odds of a continued upward trend are .

Technical Analysis (Indicators)
Bullish Trend Analysis
The RSI Oscillator points to a transition from a downward trend to an upward trend -- in cases where AAPL's RSI Indicator exited the oversold zone, of 25 resulted in an increase in price. Tickeron's analysis proposes that the odds of a continued upward trend are .
The Stochastic Oscillator suggests the stock price trend may be in a reversal from a downward trend to an upward trend. of 55 cases where AAPL's Stochastic Oscillator exited the oversold zone resulted in an increase in price. Tickeron's analysis proposes that the odds of a continued upward trend are .
Following a 3-day Advance, the price is estimated to grow further. Considering data from situations where AAPL advanced for three days, in of 356 cases, the price rose further within the following month. The odds of a continued upward trend are .
The Aroon Indicator entered an Uptrend today. In of 282 cases where AAPL Aroon's Indicator entered an Uptrend, the price rose further within the following month. The odds of a continued Uptrend are .
Bearish Trend Analysis
The Momentum Indicator moved below the 0 level on June 25, 2026. You may want to consider selling the stock, shorting the stock, or exploring put options on AAPL as a result. In of 66 cases where the Momentum Indicator fell below 0, the stock fell further within the subsequent month. The odds of a continued downward trend are .
The Moving Average Convergence Divergence Histogram (MACD) for AAPL turned negative on June 03, 2026. This could be a sign that the stock is set to turn lower in the coming weeks. Traders may want to sell the stock or buy put options. Tickeron's A.I.dvisor looked at 47 similar instances when the indicator turned negative. In of the 47 cases the stock turned lower in the days that followed. This puts the odds of success at .
AAPL moved below its 50-day moving average on June 25, 2026 date and that indicates a change from an upward trend to a downward trend.
The 10-day moving average for AAPL crossed bearishly below the 50-day moving average on June 29, 2026. This indicates that the trend has shifted lower and could be considered a sell signal. In of 18 past instances when the 10-day crossed below the 50-day, the stock continued to move higher over the following month. The odds of a continued downward trend are .
Following a 3-day decline, the stock is projected to fall further. Considering past instances where AAPL declined for three days, the price rose further in of 62 cases within the following month. The odds of a continued downward trend are .
Fundamental Analysis (Ratings)
The Tickeron SMR rating for this company is (best 1 - 100 worst), indicating very strong sales and a profitable business model. SMR (Sales, Margin, Return on Equity) rating is based on comparative analysis of weighted Sales, Income Margin and Return on Equity values compared against S&P 500 index constituents. The weighted SMR value is a proprietary formula developed by Tickeron and represents an overall profitability measure for a stock.
The Tickeron Profit vs. Risk Rating rating for this company is (best 1 - 100 worst), indicating low risk on high returns. The average Profit vs. Risk Rating rating for the industry is 95, placing this stock better than average.
The Tickeron PE Growth Rating for this company is (best 1 - 100 worst), pointing to consistent earnings growth. The PE Growth rating is based on a comparative analysis of stock PE ratio increase over the last 12 months compared against S&P 500 index constituents.
The Tickeron Seasonality Score of (best 1 - 100 worst) indicates that the company is fair valued in the industry. The Tickeron Seasonality score describes the variance of predictable price changes around the same period every calendar year. These changes can be tied to a specific month, quarter, holiday or vacation period, as well as a meteorological or growing season.
The Tickeron Price Growth Rating for this company is (best 1 - 100 worst), indicating steady price growth. AAPL’s price grows at a higher rate over the last 12 months as compared to S&P 500 index constituents.
The Tickeron Valuation Rating of (best 1 - 100 worst) indicates that the company is significantly overvalued in the industry. This rating compares market capitalization estimated by our proprietary formula with the current market capitalization. This rating is based on the following metrics, as compared to industry averages: AAPL's P/B Ratio (40.984) is very high in comparison to the industry average of (5.360). P/E Ratio (35.958) is within average values for comparable stocks, (130.461). AAPL's Projected Growth (PEG Ratio) (2.400) is slightly higher than the industry average of (1.428). Dividend Yield (0.004) settles around the average of (4.671) among similar stocks. P/S Ratio (9.766) is also within normal values, averaging (3.542).
Notable companies
Industry description
Market Cap
High and low price notable news
Volume
Fundamental Analysis Ratings
The average fundamental analysis ratings, where 1 is best and 100 is worst, are as follows

Advertisement
General Information
a manufacturer of mobile communication, media devices, personal computers, and portable digital music players
Industry ComputerPeripherals
Advertisement