


July 1, 2025, Top Performer: AI Trading Agents With the Help of Next-Type FLMs, Win Rates Exceed 85%
On July 1, 2025, Tickeron marked a new milestone in the evolution of AI-driven trading systems, unveiling a new class of Financial Learning Models (FLMs) that set a remarkable benchmark with an 80%+ win rate. These FLMs have accelerated learning cycles and market responsiveness, resulting in the launch of advanced 15-minute and 5-minute trading agents that have outperformed traditional benchmarks by a significant margin.
Enhanced Infrastructure and Faster Learning Cycles
Recent upgrades in computing infrastructure and data ingestion pipelines allowed Tickeron’s FLMs to evolve more quickly than ever. These intelligent systems now adapt in near-real-time, processing large volumes of market data and evolving their strategies in response to market conditions. As a result, newly deployed AI agents have demonstrated exceptional performance across high-liquidity tickers and inverse ETFs, combining machine learning optimization with refined pattern recognition.
Top Performing 15-Minute Trading Agents
The most notable performers among the newly released agents are those operating on a 15-minute timeframe, designed for medium-volatility market conditions. These agents utilize both intraday technical patterns and broader market sentiment analysis, delivering impressive annualized returns.
1. AAPL, GOOG, NVDA, TSLA, MSFT / SOXL, SOXS, QID, QLD
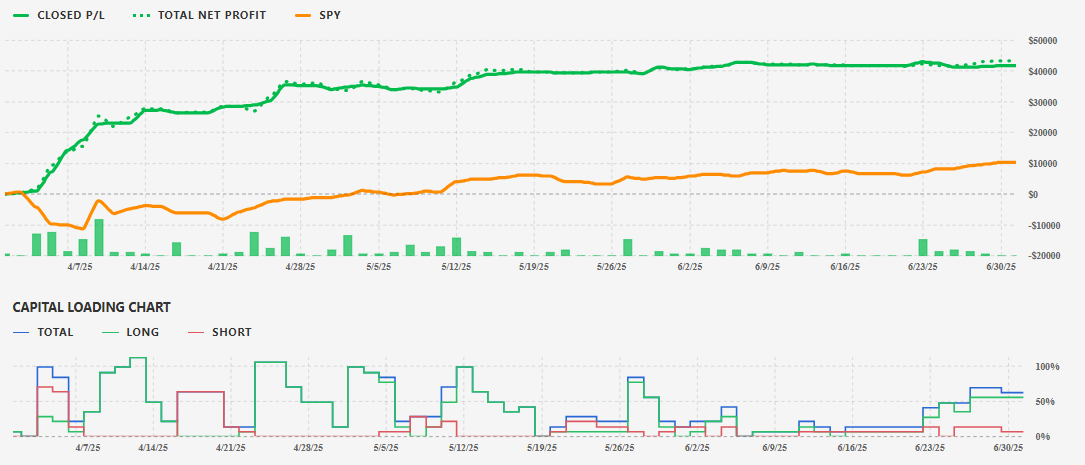
AI Trading Agent (5 Tickers), 15min
Annualized Return: +297%
By integrating large-cap tech stocks and inverse ETFs, this agent maximized market exposure and capitalized on volatility swings. Its win rate exceeded 80%, making it the top performer.
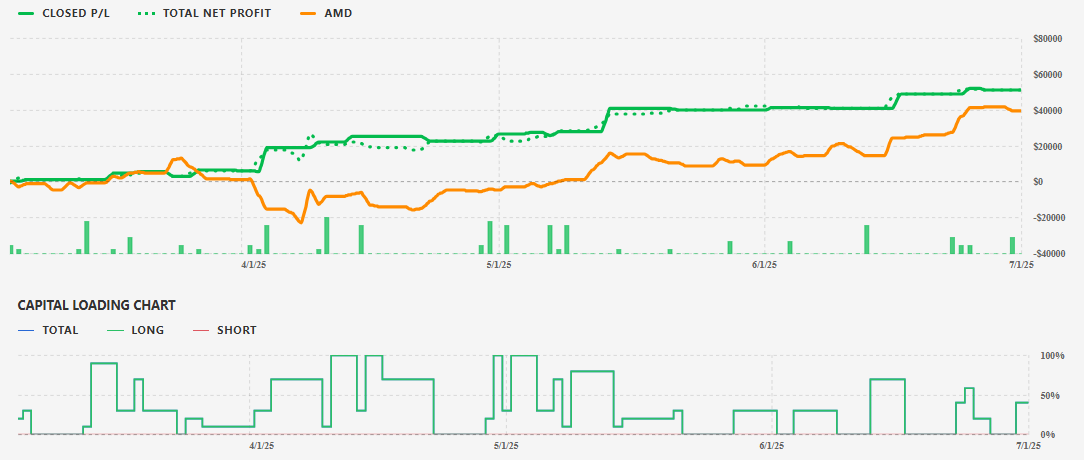
AI Trading Double Agent, 15min
Annualized Return: +253%
This dual-ticker strategy effectively leveraged AMD’s volatility with SOXS’s inverse behavior to create a dynamic hedging model suitable for medium-term traders.
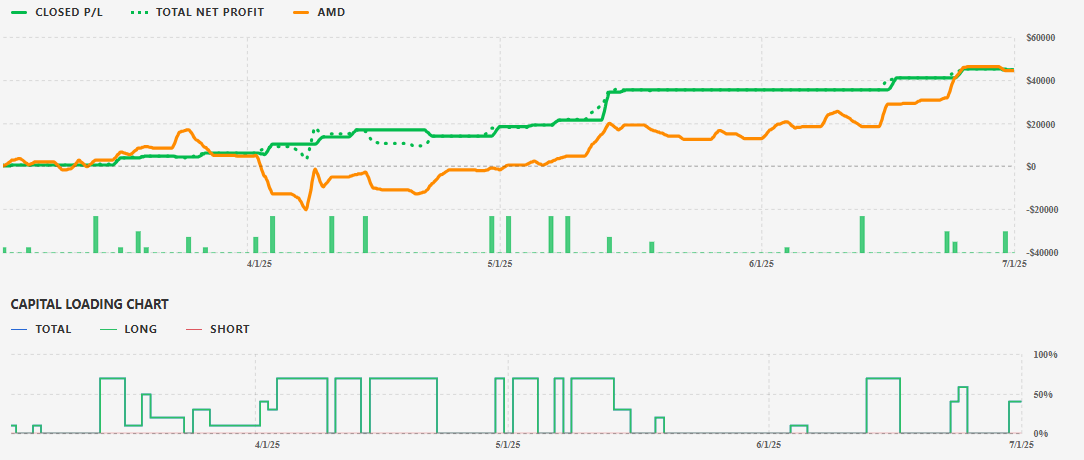
AI Trading Double Agent, 15min
Annualized Return: +206%
This agent specializes in dual exposure to AMD and its derivative counterpart, AMDS, providing diversified directional plays.
4. AAPL, GOOG, NVDA, META, MSFT

AI Trading Agent (5 Tickers), 15min
Annualized Return: +165%
A focused basket of high-growth tech names allowed this agent to ride bullish momentum while timing reversals accurately.
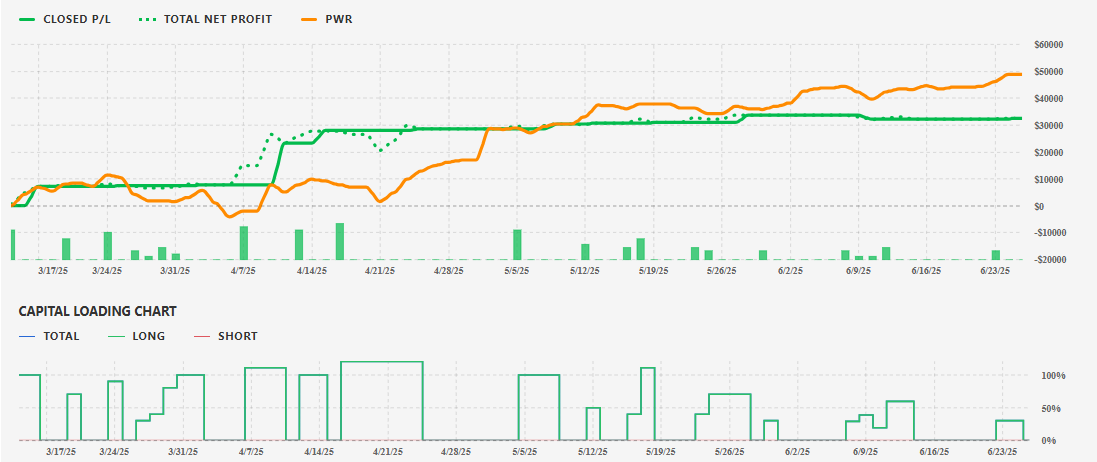
AI Trading Agent, 15min
Annualized Return: +151%
Operating with precision on a single ticker, this robot capitalized on short-term swing setups with minimal drawdown.
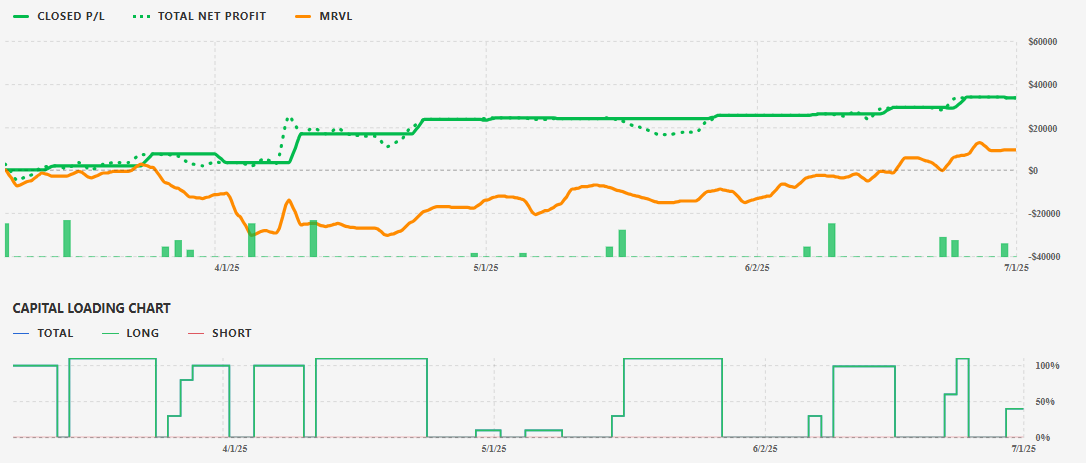
AI Trading Agent, 15min
Annualized Return: +147%
Marvell Technology proved to be a high-opportunity asset for this agent, which utilized FLM filters to isolate tradable ranges and execute exits at optimal levels.
Inverse ETFs and Strategic Positioning
Inverse ETFs such as SOXS, QID, and others were central to the success of several top-performing agents. These instruments allowed the AI systems to hedge against declining market conditions while still generating alpha. Inverse ETFs move opposite to their benchmark indices, making them ideal tools for short-term tactical plays. However, due to compounding and daily rebalancing, they are better suited for day and swing trading rather than long-term holding.
15-Minute Financial Learning Models: A Tactical Overview
FLMs operating on the 15-minute chart offer an ideal balance between signal speed and noise reduction. These models integrate several strategic features:
- Pattern Recognition on M15 Charts: Real-time identification of bullish/bearish formations.
- FLM-Based Trend Filtering: Removes short-term market noise, focusing on sustained trends.
- ML-Powered Optimization: Continuously adjusts model weights to adapt to evolving market structures.
- Daily Exit Confirmation: Ensures that intraday trades align with broader market trends.
- Capped Trade Activity: Limits simultaneous positions to 10, enhancing focus and precision.
Suitability for Novice and Intermediate Traders
These agents are not only tailored for seasoned traders but also well-suited for beginners. Tickeron has embedded daily timeframe confirmations and automated risk management into each system. By removing emotional bias and simplifying trade execution, these FLMs enable newer market participants to learn and trade simultaneously. The robots act as structured, disciplined mentors in real time.
Risk and Performance Metrics
Each robot is calibrated for maximum risk-adjusted returns:
- Max Open Positions: High – to promote diversification and exposure.
- Volatility: Medium – balances gains and protection against sharp drawdowns.
- Universe Diversification Score: Low – focuses on a concentrated basket for efficient trading.
- Profit to Dip Ratio: Medium – indicating stable profit potential with manageable dips.
These metrics ensure the robots operate effectively in medium-volatility markets, the most common environment for active traders.
Behind the Technology: Tickeron’s Vision
Led by CEO Sergey Savastiouk, Tickeron has emerged as a leader in financial AI through the creation of FLMs. These systems bridge the gap between retail traders and institutional-level analytics. With intuitive UIs and sophisticated engines under the hood, Tickeron’s products reflect a deep understanding of how AI can democratize access to the markets.
Among its suite are:
- Beginner Bots – Easy-to-use trading tools that offer pre-analyzed signals.
- Double Agents – AI tools that provide long/short market signals for the same pair.
- Real-Time FLM Dashboards – Allowing users to monitor performance and market signals as they evolve.
Conclusion: The Future of Trading is Now
The July 1, 2025, performance report is not merely a celebration of impressive annualized returns but a signal that the financial industry is undergoing a structural shift. Tickeron's next-generation Financial Learning Models represent a transformative step forward, turning market data into actionable intelligence with minimal lag and high confidence. With 80%+ win rates and up to 297% annualized returns, these AI agents redefine what's possible in retail trading.
By combining speed, precision, and accessibility, Tickeron empowers a new class of traders—those who understand that in today’s markets, intelligence wins.
AAPL in upward trend: price may jump up because it broke its lower Bollinger Band on June 25, 2026
AAPL may jump back above the lower band and head toward the middle band. Traders may consider buying the stock or exploring call options. In of 27 cases where AAPL's price broke its lower Bollinger Band, its price rose further in the following month. The odds of a continued upward trend are .

Technical Analysis (Indicators)
Bullish Trend Analysis
The RSI Oscillator points to a transition from a downward trend to an upward trend -- in cases where AAPL's RSI Indicator exited the oversold zone, of 25 resulted in an increase in price. Tickeron's analysis proposes that the odds of a continued upward trend are .
The Stochastic Oscillator suggests the stock price trend may be in a reversal from a downward trend to an upward trend. of 55 cases where AAPL's Stochastic Oscillator exited the oversold zone resulted in an increase in price. Tickeron's analysis proposes that the odds of a continued upward trend are .
Following a 3-day Advance, the price is estimated to grow further. Considering data from situations where AAPL advanced for three days, in of 356 cases, the price rose further within the following month. The odds of a continued upward trend are .
The Aroon Indicator entered an Uptrend today. In of 282 cases where AAPL Aroon's Indicator entered an Uptrend, the price rose further within the following month. The odds of a continued Uptrend are .
Bearish Trend Analysis
The Momentum Indicator moved below the 0 level on June 25, 2026. You may want to consider selling the stock, shorting the stock, or exploring put options on AAPL as a result. In of 66 cases where the Momentum Indicator fell below 0, the stock fell further within the subsequent month. The odds of a continued downward trend are .
The Moving Average Convergence Divergence Histogram (MACD) for AAPL turned negative on June 03, 2026. This could be a sign that the stock is set to turn lower in the coming weeks. Traders may want to sell the stock or buy put options. Tickeron's A.I.dvisor looked at 47 similar instances when the indicator turned negative. In of the 47 cases the stock turned lower in the days that followed. This puts the odds of success at .
AAPL moved below its 50-day moving average on June 25, 2026 date and that indicates a change from an upward trend to a downward trend.
The 10-day moving average for AAPL crossed bearishly below the 50-day moving average on June 29, 2026. This indicates that the trend has shifted lower and could be considered a sell signal. In of 18 past instances when the 10-day crossed below the 50-day, the stock continued to move higher over the following month. The odds of a continued downward trend are .
Following a 3-day decline, the stock is projected to fall further. Considering past instances where AAPL declined for three days, the price rose further in of 62 cases within the following month. The odds of a continued downward trend are .
Fundamental Analysis (Ratings)
The Tickeron SMR rating for this company is (best 1 - 100 worst), indicating very strong sales and a profitable business model. SMR (Sales, Margin, Return on Equity) rating is based on comparative analysis of weighted Sales, Income Margin and Return on Equity values compared against S&P 500 index constituents. The weighted SMR value is a proprietary formula developed by Tickeron and represents an overall profitability measure for a stock.
The Tickeron Profit vs. Risk Rating rating for this company is (best 1 - 100 worst), indicating low risk on high returns. The average Profit vs. Risk Rating rating for the industry is 95, placing this stock better than average.
The Tickeron PE Growth Rating for this company is (best 1 - 100 worst), pointing to consistent earnings growth. The PE Growth rating is based on a comparative analysis of stock PE ratio increase over the last 12 months compared against S&P 500 index constituents.
The Tickeron Seasonality Score of (best 1 - 100 worst) indicates that the company is fair valued in the industry. The Tickeron Seasonality score describes the variance of predictable price changes around the same period every calendar year. These changes can be tied to a specific month, quarter, holiday or vacation period, as well as a meteorological or growing season.
The Tickeron Price Growth Rating for this company is (best 1 - 100 worst), indicating steady price growth. AAPL’s price grows at a higher rate over the last 12 months as compared to S&P 500 index constituents.
The Tickeron Valuation Rating of (best 1 - 100 worst) indicates that the company is significantly overvalued in the industry. This rating compares market capitalization estimated by our proprietary formula with the current market capitalization. This rating is based on the following metrics, as compared to industry averages: AAPL's P/B Ratio (40.984) is very high in comparison to the industry average of (5.360). P/E Ratio (35.958) is within average values for comparable stocks, (130.461). AAPL's Projected Growth (PEG Ratio) (2.400) is slightly higher than the industry average of (1.428). Dividend Yield (0.004) settles around the average of (4.671) among similar stocks. P/S Ratio (9.766) is also within normal values, averaging (3.542).
Notable companies
Industry description
Market Cap
High and low price notable news
Volume
Fundamental Analysis Ratings
The average fundamental analysis ratings, where 1 is best and 100 is worst, are as follows

Advertisement
General Information
a manufacturer of mobile communication, media devices, personal computers, and portable digital music players
Industry ComputerPeripherals
Advertisement