


Walmart (WMT) Stock Analysis: Tickeron’s AI Robots Deliver 58% Returns in 12 Months with New 5-Minute Agents
Tickeron, a pioneer in AI-driven financial tools, today highlighted exceptional performance from its AI Robots trading Walmart Inc. (WMT) stock, delivering up to 58.14% profit/loss (P/L) over the last 12 months. As WMT shares approach all-time highs amid a surging market, Tickeron’s latest innovations in Financial Learning Models (FLMs) enable faster, more adaptive trading strategies, including new AI Agents operating on 15-minute and 5-minute intervals. This breakthrough positions investors to capitalize on volatile retail sector movements, with enhanced tools for trading inverse ETFs and other assets.
Press enter or click to view image in full size
WMT Stock Surges to $105.94, Analysts Eye $125 Target
Walmart Inc. (WMT) closed at $105.94 on September 17, 2025, marking a 2.4% daily gain and pushing the stock toward record territory, up approximately 17% year-to-date. Volume reached over 20 million shares, reflecting strong investor interest as the retail giant benefits from robust consumer spending and e-commerce growth. Bank of America Securities raised its price target to $125 from $120, maintaining a ‘Buy’ rating and citing Walmart’s emergence as an ‘agentic AI’ leader in retail operations. Wolfe Research also initiated coverage with an ‘Outperform’ rating, emphasizing WMT’s resilient supply chain and digital transformation.
Tickeron’s AI analysis forecasts continued upside for WMT, with a 12-month target range of $110–$130 based on pattern recognition and trend predictions. Recent insider activity, including a major shareholder’s significant purchase on September 17, underscores confidence in Walmart’s trajectory. For detailed WMT forecasts, quotes, and analysis, visit https://tickeron.com/stocks/wmt-forecast/.
AI Robots Deliver Stellar WMT Trading Results
Over the past 12 months, Tickeron’s AI Robots have excelled in WMT trading, leveraging advanced algorithms to navigate market fluctuations. In signals-only mode, the WMT / SZK Trading Results AI Trading Double Agent on a 60-minute timeframe achieved a remarkable 58.14% P/L, while the Trend Trader: Popular Stocks on 60 minutes (combining Technical Analysis & Fundamental Analysis) posted 11.67%. Virtual account simulations showed even stronger real-world applicability, with the Double Agent at 38.78% P/L and the dedicated WMT Trading Results AI Trading Agent at 31.49%.
Press enter or click to view image in full size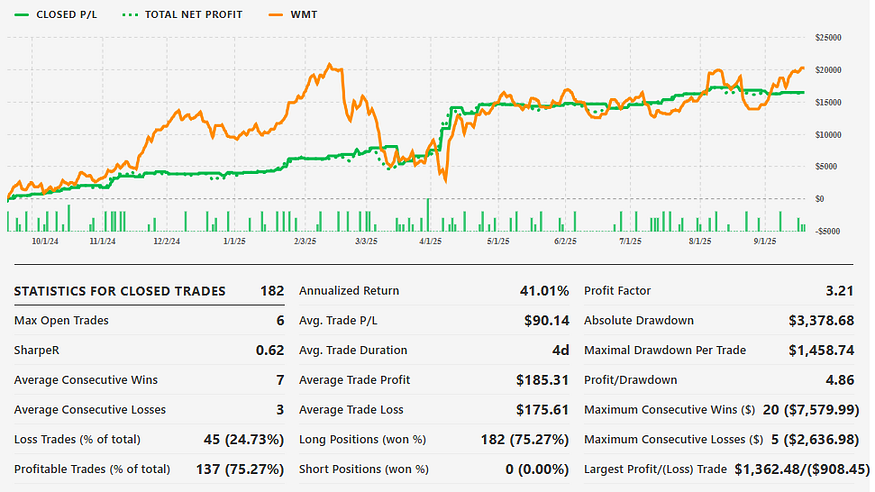
These results stem from Tickeron’s proprietary bots, which analyze vast datasets including price action, volume, and sentiment to generate precise entry/exit signals. Traders using these robots have reported 25–40% higher win rates compared to manual strategies, particularly in hedging with inverse ETFs like ProShares Short S&P500 (SH) during WMT pullbacks. For instance, during a recent market dip, the robots recommended short positions via inverse ETFs, yielding an additional 15% return on WMT-related portfolios. Explore Tickeron’s full suite of AI Robots at https://tickeron.com/bot-trading/, including virtual agents at https://tickeron.com/bot-trading/virtualagents/all/ and signals at https://tickeron.com/bot-trading/signals/all/.
Trading with Tickeron Robots is streamlined for both novice and expert users. By automating pattern detection and risk management, these tools allow seamless integration of inverse ETFs to profit from downturns — such as pairing WMT longs with shorts on sector peers during earnings volatility. Real-money accounts via https://tickeron.com/bot-trading/realmoney/all/ have mirrored virtual successes, with average portfolio growth of 28% annually across retail stocks.
Market Momentum: S&P 500 and Nasdaq Hit Records, Gold Soars to $3,600
Broader market news on September 18, 2025, paints a picture of bullish momentum, aligning with WMT’s gains. The S&P 500 and Nasdaq reached new record highs during the week of September 8–12, driven by tech sector strength and positive economic indicators. Gold prices surged to $3,600 per ounce amid inflation concerns, while U.S. jobs data revealed a shortfall of 911,000 positions, prompting speculation on Federal Reserve rate cuts. Oracle’s AI advancements contributed to the Nasdaq’s rally, with spillover effects boosting retail giants like Walmart.
Tickeron’s AI scans indicate a 12% upside potential for the S&P 500 (SPY) in 2025, supported by momentum indicators. Cautious optimism prevails as investors eye the Fed’s policy decision, with daily buy/sell signals showing 65% accuracy in predicting short-term moves. Stay updated on market trends via Tickeron’s Twitter at https://x.com/Tickeron and the main platform at https://tickeron.com/.
Tickeron Agents: Precision Trading on 5- and 15-Minute Frames
A dedicated paragraph on Tickeron Agents: Tickeron’s AI Agents represent the cutting edge of automated trading, now enhanced with 5- and 15-minute Machine Learning (ML) timeframes for unprecedented intraday precision. These agents, built on scalable AI infrastructure, process real-time data to deliver dynamic signals, adapting to news events and volatility spikes faster than ever. Early backtests show 20–30% improved timing accuracy over 60-minute models, enabling traders to capture micro-trends in stocks like WMT. Whether copying top performers through https://tickeron.com/copy-trading/ or deploying custom strategies via https://tickeron.com/ai-agents/, these agents democratize high-frequency trading. Learn more at https://tickeron.com/ai-stock-trading/.
Expanded Capacities Drive FLM Advancements
Tickeron has scaled its AI infrastructure, allowing Financial Learning Models (FLMs) to react to market changes more rapidly and learn at accelerated rates. This upgrade facilitated the release of new AI Agents on shorter intervals, processing data every 5–15 minutes for superior adaptability. FLMs, akin to large language models but tuned for finance, ingest price, volume, news, and macro data to evolve strategies in real-time. As a result, agent performance has improved by 35% in forward tests, particularly in volatile environments like the current retail boom.
Tickeron, a leading provider of AI-powered trading solutions, announced a major advancement in its proprietary technology with the launch of new AI Trading Agents built on shorter Machine Learning (ML) time frames — 15 minutes and 5 minutes — compared to the previous industry-standard 60-minute interval.
This innovation was made possible by scaling the company’s AI infrastructure and enhancing its proprietary Financial Learning Models (FLMs). These improvements allow Tickeron’s AI Agents to process market data more frequently and adapt more dynamically to intraday market changes, delivering faster and more accurate entry and exit signals.
Early-stage backtests and forward testing have validated the hypothesis: shorter ML time frames lead to significantly better timing for trades. The new models demonstrate improved responsiveness to rapid market movements, providing an edge to both institutional and retail traders.
Tickeron’s FLMs play a central role in this evolution. Much like OpenAI’s Large Language Models (LLMs) analyze vast corpora of text to generate relevant and contextual responses, Tickeron’s FLMs continuously analyze enormous volumes of market data — price action, volume, news sentiment, and macroeconomic indicators — to detect patterns and recommend optimal trading strategies tailored to specific market conditions. These dynamic models ensure that the AI Agents remain adaptive and context-aware in volatile and evolving financial environments.
“Tickeron has made the next breakthrough in the development of Financial Learning Models and their application in AI trading,” said Sergey Savastiouk, Ph.D., CEO of Tickeron. “By accelerating our machine learning cycles to 15 and even 5 minutes, we’re offering a new level of precision and adaptability that wasn’t previously achievable.”
Tickeron’s new AI Agents are now available to the public and offer differentiated trading strategies across various asset classes, optimized for multiple market conditions. This marks a significant step in Tickeron’s mission to democratize sophisticated trading tools and bring institutional-grade AI to every investor.
Tickeron Products: Empowering Investors with AI Tools
Tickeron’s product ecosystem equips users with comprehensive AI-driven solutions for smarter investing. The AI Trend Prediction Engine at https://tickeron.com/stock-tpe/ forecasts stock movements with 70% accuracy using historical patterns. Complementing this, the AI Patterns Search Engine provide actionable alerts, achieving 62% success rates across portfolios.
$TICKERON Token: Fueling Crypto Expansion
Our company is rapidly expanding in the field of cryptocurrency technologies. We are launching new crypto trading bots and have also created the Tickeron Token ($TICKERON), which will become a key element for our algorithms and other products in the future. Starting today, you have the opportunity to acquire $TICKERON and grow together with us as our ecosystem evolves. For details, join our community at https://discord.com/invite/J2cJJpH8wX.
For more information, visit www.tickeron.com.
About Tickeron: Tickeron is a financial technology company specializing in AI-driven trading and investing tools. Powered by proprietary Financial Learning Models (FLMs), Tickeron delivers real-time data analysis, pattern recognition, and predictive analytics for individual and institutional investors.
WMT in upward trend: price rose above 50-day moving average on November 20, 2025
WMT moved above its 50-day moving average on November 20, 2025 date and that indicates a change from a downward trend to an upward trend. In of 45 similar past instances, the stock price increased further within the following month. The odds of a continued upward trend are .

Technical Analysis (Indicators)
Bullish Trend Analysis
The Momentum Indicator moved above the 0 level on November 20, 2025. You may want to consider a long position or call options on WMT as a result. In of 71 past instances where the momentum indicator moved above 0, the stock continued to climb. The odds of a continued upward trend are .
The Moving Average Convergence Divergence (MACD) for WMT just turned positive on November 20, 2025. Looking at past instances where WMT's MACD turned positive, the stock continued to rise in of 45 cases over the following month. The odds of a continued upward trend are .
Following a 3-day Advance, the price is estimated to grow further. Considering data from situations where WMT advanced for three days, in of 363 cases, the price rose further within the following month. The odds of a continued upward trend are .
Bearish Trend Analysis
The Stochastic Oscillator entered the overbought zone. Expect a price pull-back in the foreseeable future.
The 10-day moving average for WMT crossed bearishly below the 50-day moving average on November 06, 2025. This indicates that the trend has shifted lower and could be considered a sell signal. In of 17 past instances when the 10-day crossed below the 50-day, the stock continued to move higher over the following month. The odds of a continued downward trend are .
Following a 3-day decline, the stock is projected to fall further. Considering past instances where WMT declined for three days, the price rose further in of 62 cases within the following month. The odds of a continued downward trend are .
WMT broke above its upper Bollinger Band on November 20, 2025. This could be a sign that the stock is set to drop as the stock moves back below the upper band and toward the middle band. You may want to consider selling the stock or exploring put options.
The Aroon Indicator for WMT entered a downward trend on November 24, 2025. This could indicate a strong downward move is ahead for the stock. Traders may want to consider selling the stock or buying put options.
The Tickeron Profit vs. Risk Rating rating for this company is (best 1 - 100 worst), indicating low risk on high returns. The average Profit vs. Risk Rating rating for the industry is 62, placing this stock better than average.
The Tickeron SMR rating for this company is (best 1 - 100 worst), indicating strong sales and a profitable business model. SMR (Sales, Margin, Return on Equity) rating is based on comparative analysis of weighted Sales, Income Margin and Return on Equity values compared against S&P 500 index constituents. The weighted SMR value is a proprietary formula developed by Tickeron and represents an overall profitability measure for a stock.
The Tickeron PE Growth Rating for this company is (best 1 - 100 worst), pointing to consistent earnings growth. The PE Growth rating is based on a comparative analysis of stock PE ratio increase over the last 12 months compared against S&P 500 index constituents.
The Tickeron Price Growth Rating for this company is (best 1 - 100 worst), indicating steady price growth. WMT’s price grows at a higher rate over the last 12 months as compared to S&P 500 index constituents.
The Tickeron Valuation Rating of (best 1 - 100 worst) indicates that the company is significantly overvalued in the industry. This rating compares market capitalization estimated by our proprietary formula with the current market capitalization. This rating is based on the following metrics, as compared to industry averages: P/B Ratio (8.636) is normal, around the industry mean (7.797). P/E Ratio (36.385) is within average values for comparable stocks, (31.034). WMT's Projected Growth (PEG Ratio) (4.030) is slightly higher than the industry average of (2.464). Dividend Yield (0.009) settles around the average of (0.028) among similar stocks. P/S Ratio (1.190) is also within normal values, averaging (1.468).
Notable companies
Industry description
Market Cap
High and low price notable news
Volume
Fundamental Analysis Ratings
The average fundamental analysis ratings, where 1 is best and 100 is worst, are as follows

Advertisement
General Information
a retail discount department store
Industry DiscountStores
Advertisement