MENU
Go to the list of all blogs
Serhii Bondarenko's Avatar
published in Blogs
Mar 08, 2025

Week (March 3 - 7) in Review: Financial Leaders

The week was marked by significant financial events that influenced global markets. Notably, the FTSE 100 Index reached an all-time high, closing at 8,871.31 on March 3, 2025, surpassing its previous records. This surge was driven by strong performances in sectors such as mining and banking. Conversely, the U.S. stock markets faced volatility due to uncertainties surrounding trade policies and economic data, leading to declines in major indices.

Global Overview

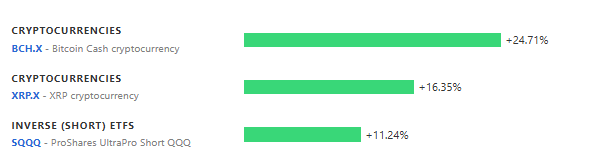
The global financial landscape experienced notable fluctuations this week. Cryptocurrencies like Bitcoin Cash (BCH) and XRP saw significant gains of 24.96% and 16.64%, respectively, reflecting increased investor interest. However, traditional commodities such as the United States Oil Fund (USO) declined by 4.35%, indicating potential shifts in energy markets. Major indexes, including the iShares Russell 2000 ETF (IWM), decreased by 4.36%, highlighting broader market apprehensions.​

Sector Overview

Sector-specific performances varied throughout the week. The financial sector, represented by the iShares MSCI Europe Financials ETF (EUFN), rose by 5.36%, possibly due to positive earnings reports from European banks. The materials sector also performed well, with ETFs like VanEck Rare Earth & Strategic Metals (REMX) and iShares MSCI Global Metals & Mining Producers (PICK gaining 4.72% and 3.26%, respectively, driven by increased demand for industrial metals. In contrast, the technology sector faced challenges; the First Trust Cloud Computing ETF (SKYY) dropped by 7.37%, and the Invesco S&P SmallCap Consumer Discretionary ETF (PSCD) fell by 8.27%, suggesting investor caution in these areas.​

International Overview

International markets displayed mixed results. European ETFs, such as the iShares MSCI Eurozone ETF (EZU) and the JPMorgan BetaBuilders Europe ETF (BBEU), experienced gains of 5.15% and 3.49%, respectively, indicating optimism in the European economy. Latin American markets also showed strength, with the First Trust Brazil AlphaDEX® ETF (FBZ) increasing by 4.04%. Conversely, North American ETFs like the iShares Core S&P 500 ETF (IVV) and the Vanguard Total Stock Market ETF (VTI) declined by over 4%, reflecting investor concerns about the U.S. economic outlook.​

Summary

This week underscored the dynamic nature of global financial markets. While certain sectors and regions experienced growth, others faced declines due to various economic and geopolitical factors. Investors are advised to remain vigilant and consider diversification to navigate the evolving financial landscape effectively.

Disclaimers and Limitations


Related Ticker: USO, BCH, XRP.X, EUFN, REMX, PICK, SKYY, PSCD, BBEU, EZU, FBZ, IVV, VTI

USO saw its Stochastic Oscillator peaks and leaves the overbought zone

The Stochastic Oscillator for USO moved out of overbought territory on May 22, 2025. This could be a bearish sign for the stock and investors may want to consider selling or taking a defensive position. A.I.dvisor looked at 65 similar instances where the indicator exited the overbought zone. In of the 65 cases the stock moved lower. This puts the odds of a downward move at .

Price Prediction Chart

Technical Analysis (Indicators)

Bearish Trend Analysis

Following a 3-day decline, the stock is projected to fall further. Considering past instances where USO declined for three days, the price rose further in of 62 cases within the following month. The odds of a continued downward trend are .

Bullish Trend Analysis

The Momentum Indicator moved above the 0 level on June 02, 2025. You may want to consider a long position or call options on USO as a result. In of 83 past instances where the momentum indicator moved above 0, the stock continued to climb. The odds of a continued upward trend are .

The Moving Average Convergence Divergence (MACD) for USO just turned positive on May 09, 2025. Looking at past instances where USO's MACD turned positive, the stock continued to rise in of 51 cases over the following month. The odds of a continued upward trend are .

USO moved above its 50-day moving average on June 02, 2025 date and that indicates a change from a downward trend to an upward trend.

Following a 3-day Advance, the price is estimated to grow further. Considering data from situations where USO advanced for three days, in of 349 cases, the price rose further within the following month. The odds of a continued upward trend are .

USO may jump back above the lower band and head toward the middle band. Traders may consider buying the stock or exploring call options.

Industry description

The investment seeks the daily changes in percentage terms of its shares’ per share NAV to reflect the daily changes in percentage terms of the spot price of light, sweet crude oil delivered to Cushing, Oklahoma, as measured by the daily changes in the price of a specified short-term futures contract on light, sweet crude oil called the “Benchmark Oil Futures Contract,” plus interest earned on USO’s collateral holdings, less USO’s expenses. USO invests primarily in futures contracts for light, sweet crude oil, other types of crude oil, diesel-heating oil, gasoline, natural gas, and other petroleum-based fuels.
View a ticker or compare two or three
USO
Daily Signalchanged days ago
Gain/Loss if bought
Show more...
Interact to see
Advertisement
A.I.Advisor
published price charts
A.I. Advisor
published General Information

General Information

Category CommoditiesBroadBasket

Profile
Fundamentals
Details
Category
Commodities Focused
Address
1320 Harbor Bay ParkwaySuite 145Almadeda
Phone
403-233-9366
Web
www.unitedstatesoilfund.com
Interact to see
Advertisement
Paper wallets are extremely useful tools – beyond being one of the most popular and secure cold storage methods, they make it simple to transfer coins between owners.You can access the funds on your paper wallet by “sweeping” (or importing) them to either a live wallet (like Trezor or Exodus) or an exchange service (like Coinbase). Most services allow you to import them directly from your wallet’s private key, but there are two key exceptions.
Learn the 27 essential intraday trading rules that every manual trader should master—and discover how Tickeron’s AI platform applies them automatically for consistent, emotion-free execution and smarter, real-time decision-making.
#investment#trading
A $2 trillion sell-off has investors asking: is 2025 the next dot-com crash or a replay of the 2008 recession? This deep dive compares both scenarios, outlines warning signs, and reveals how AI-powered trading strategies can help navigate rising volatility.
#trading#investment
New to trading? Discover 21 powerful lessons every beginner must learn—and see how Tickeron’s AI Double Agent strategies apply them in real time. From mastering risk to managing emotions, this guide helps you trade smarter, safer, and more confidently.
#investment#trading
From the railroads of the 1920s to the AI giants of 2025, market history shows that extreme concentration often precedes massive bubbles and crashes. This article explores five key turning points and how Tickeron’s AI helps traders navigate today’s bubble-prone landscape.
#investment#trading
U.S. tariff tensions rocked markets this week, sending tech stocks into retreat and safe-haven assets like gold and the yen soaring. As investors brace for major earnings and global policy shifts, volatility remains high across equities, currencies, and commodities.
#investment#trading
Tesla’s Q1 2025 earnings could surprise investors as the EV giant looks to rebound from last quarter’s miss. With lowered expectations and increased volatility, Tickeron’s AI-powered strategy helps traders navigate both upside potential and downside risk.
#investment#trading
Gold is on a historic run—up 29% YTD with record-breaking inflows and growing macro tailwinds. Discover why smart investors are eyeing gold, silver, and miners for opportunity, and how AI trading tools are unlocking new ways to profit from the 2025 gold rush.
#investment#trading
Tickeron launches its innovative Double Agent Trading Bot, combining long NVDA trades with hedged NVDS positions. Using AI-driven pattern trading and real-time risk management, the bot achieves a 75% success rate, revolutionizing automated trading strategies.
#trading#investment
Tickeron’s AI trading bots are setting new standards in finance, achieving up to 86.6% win rates across leveraged and sector ETFs. Powered by advanced Financial Learning Models (FLMs), Tickeron’s AI delivers precision, adaptability, and real-time trading success.
#trading
Wall Street expects strong profit growth from the Magnificent Seven tech giants in 2025. Discover how to trade Apple, Microsoft, Amazon, Nvidia, Tesla, Meta, and Alphabet using AI-powered Double Agent strategies and smart hedging with inverse ETFs like QID.
On May 2, 2025, a diverse group of companies across energy, financial services, basic materials, consumer discretionary, and healthcare will release their Q1 2025 earnings.
In April 2025, five tech giants—NVIDIA, Tesla, Meta, Palantir, and Amazon—each surged over 40%, driven by AI breakthroughs, strong earnings, and market momentum. Discover what fueled the rally and how Tickeron’s AI trading bots helped investors outperform even these star stocks.
#investment
Markets ended April with mixed signals—gold slid on trade optimism, Big Tech lifted the Nasdaq, and Bitcoin steadied near $94K. With U.S. GDP contracting and job growth beating forecasts, investors brace for more volatility amid tariffs and central bank moves.
In a turbulent market, Tickeron's AI-powered Double Agent Bot is outperforming traditional strategies. Leveraging real-time intraday signals and inverse ETFs, the bot posted a +9.77% quarterly gain while the S&P 500 dropped 9.28%. Here's how AI is reshaping trading.
#trading
As Warren Buffett announces his retirement, investors turn to his trusted Buffett Indicator—a ratio of market cap to GDP—as a key gauge of market valuation.
#investment
Markets move in repeating cycles—Accumulation, Uptrend, Distribution, and Downtrend. Learn how to recognize each phase and deploy Tickeron’s AI-powered Double Agent strategy to adapt, protect capital, and profit in any market condition.
#trading
Discover how confirmation trading techniques—like moving average crossovers and volume-backed breakouts—can improve accuracy and reduce false signals. Learn how Tickeron’s AI automates these strategies for smarter, faster, and more disciplined trading.
#trading
Hedge funds are ramping up bearish bets on small-cap stocks, with Russell 2000 short interest hitting new highs. As macro headwinds mount and technical support teeters, Tickeron’s AI Double Agents step in to navigate the looming sell-off with precision.
#investment#trading#artificial_intelligence
SPY’s Momentum Indicator turned bullish on April 25, 2025, signaling a potential trend shift with a 90% historical success rate. This article explores how economic scarcity, technical signals, and AI-driven tools like Tickeron’s A.I.dvisor shape investor decisions in volatile markets.
#trading