Real Time Patterns (RTP)
- Set up pattern search criteria
- Receive patterns in your feed
Real-time pattern trading is a smart way to find entry and exit prices if you can scan thousands of stocks and ETFs within minutes. It is definitely impossible for humans. Artificial Intelligence (A.I.) not only discovers these patterns, but also checks if they worked out well in the past. Knowing the success rate in the past allows A.I. to establish the odds of success in the future.


Broadening Bottom


The Broadening Bottom pattern forms when a security price makes higher highs (2, 4) and lower lows (1, 3, 5) following two widening trend lines. The price is expected to move up or down past the pattern depending on which line is broken first. What distinguishes a Broadening Bottom from a Broadening Top is that the price of the security is declining prior to entering the pattern formation.
This type of formation happens when volatility is high or increasing, and when a security's price is moving with high volatility but or no direction. It potentially indicates growing investor nervousness and a little indecisiveness.
Trade Idea
If the price breaks out from the bottom pattern boundary, day traders and swing traders should trade with a DOWN trend. Consider selling the security short or buying a put option at the downward breakout price level. To identify an exit, compute the Target Price by subtracting the pattern height from the breakout point. Pattern height is a difference between patterns highest high and its lowest low.
To limit potential loss when price suddenly goes in the wrong direction, consider placing a stop order to buy back a short position or sell a put option at or above the breakout price.
Time frames No matter your trading strategy (day trading, swing, etc), we have patterns that will be ready to trade.
Broadening Bottom (Bearish)
29.37 USD CURRENT PRICE
PDCO - Patterson Companies Inc.
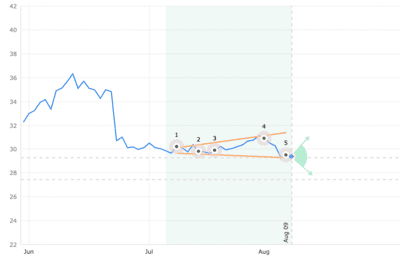
| STATUS | Emerged |
|---|---|
| CURRENT CONFIDENCE | 51% |
| TARGET (EXIT) PRICE | 29.28 USD |
| BREAKOUT (ENTRY) PRICE | 27.43 USD |
| DISTANCE TO TARGET PRICE | 6.61% |
| EMERGED ON | Aug 06, closing price |
| WITH CONFIDENCE LEVEL | 53% |
Statistics for ‘Broadening Bottom‘
Broadening Bottom (Bearish)
5.97 USD CURRENT PRICE
WVE - Wave Life Sciences Ltd.
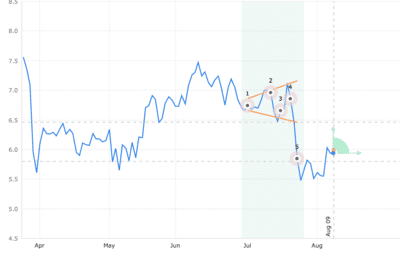
| STATUS | Emerged |
|---|---|
| CURRENT CONFIDENCE | 100% |
| TARGET (EXIT) PRICE | 6.46 USD |
| BREAKOUT (ENTRY) PRICE | 5.80 USD |
| DISTANCE TO TARGET PRICE | 2.85% |
| EMERGED ON | Jul 23, closing price |
| WITH CONFIDENCE LEVEL | 100% |
Statistics for ‘Broadening Bottom‘
Broadening Bottom (Bearish)
26.91 USD CURRENT PRICE
HPP - Hudson Pacific Properties Inc
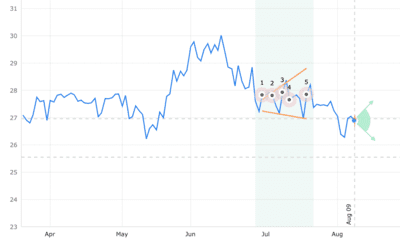
| STATUS | Emerged |
|---|---|
| CURRENT CONFIDENCE | 51% |
| TARGET (EXIT) PRICE | 26.96 USD |
| BREAKOUT (ENTRY) PRICE | 25.55 USD |
| DISTANCE TO TARGET PRICE | 4.84% |
| EMERGED ON | Jul 20, closing price |
| WITH CONFIDENCE LEVEL | 51% |
Statistics for ‘Broadening Bottom‘
Broadening Bottom (Bearish)
20.92 USD CURRENT PRICE
RCM - R1 RCM Inc
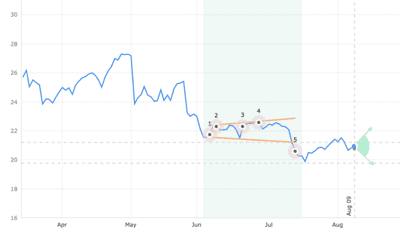
| STATUS | Emerged |
|---|---|
| CURRENT CONFIDENCE | 51% |
| TARGET (EXIT) PRICE | 21.20 USD |
| BREAKOUT (ENTRY) PRICE | 19.75 USD |
| DISTANCE TO TARGET PRICE | 5.59% |
| EMERGED ON | Jul 14, closing price |
| WITH CONFIDENCE LEVEL | 51% |
Statistics for ‘Broadening Bottom‘
Broadening Bottom (Bearish)
77.17 USD CURRENT PRICE
ENV - Envestnet Inc.
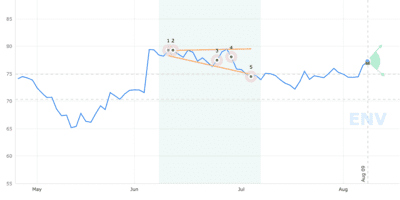
| STATUS | Emerged |
|---|---|
| CURRENT CONFIDENCE | 53% |
| TARGET (EXIT) PRICE | 74.89 USD |
| BREAKOUT (ENTRY) PRICE | 70.32 USD |
| DISTANCE TO TARGET PRICE | 8.87% |
| EMERGED ON | Jul 06, closing price |
| WITH CONFIDENCE LEVEL | 53% |