


Analyze 39 Chart Patterns with AI — Start Free Today
Tickeron, a leader in AI-powered financial analytics, proudly introduces its upgraded Pattern Search Engine (PSE) — an intelligent screener designed to detect chart patterns across stocks, ETFs, penny stocks, crypto, and forex with ease and precision.
With a simple workflow — set criteria, receive patterns, bookmark, and track performance — users gain instant access to actionable trade setups.
Start your free 14-day trial, then continue for just $30/month at Tickeron.com — click “Try Now.”
“TRY NOW”.

Screener for Stock Chart Patterns ᐉ Pattern Search Engine (PSE)
Simplified Workflow for Smarter Pattern Trading
The enhanced PSE turns complex pattern analysis into a streamlined, intuitive process:
-
Choose your criteria — asset class, price range, confidence level, and pattern types.
-
Monitor your feed — receive automatically identified chart patterns.
-
Bookmark key setups — track breakout, target, and live status.
-
Stay informed — get notifications via email or push alerts.
It’s truly “set-and-receive” intelligence — no complicated setup required, just focused insights powered by AI.
Screener for Stock Chart Patterns ᐉ Pattern Search Engine (PSE)
Sophisticated Pattern Trading Meets AI
Trading chart patterns remains one of the most advanced strategies in equities and derivatives markets because it exploits the psychology of market participants and combines it with structural insights. The new PSE uses artificial intelligence to uncover these hidden dynamics and deliver them in a usable feed.
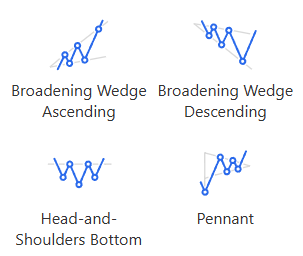
By leveraging the PSE, users are taught by AI to recognize classic patterns and their likely entry and exit points. Every day, the PSE scans thousands of symbols — stocks, ETFs, penny stocks, crypto, forex — for 39 distinct pattern types, including:
Screener for Stock Chart Patterns ᐉ Pattern Search Engine (PSE)
- Broadening Bottom, Broadening Top
- Broadening Wedge Ascending/Descending
- Cup-and-Handle, Flag
- Head-and-Shoulders Bottom, Pennant
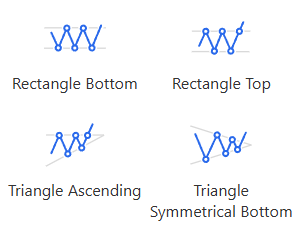
- Rectangle Bottom/Top
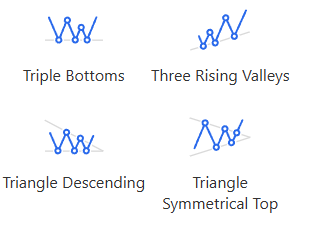
- Triple Bottoms, Three Rising Valleys
- Triangle Ascending, Symmetrical Bottom, Triangle Descending, Symmetrical Top
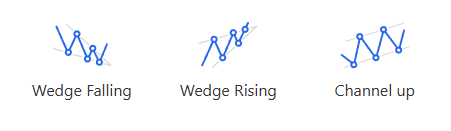
- Wedge Falling/Rising, Channel Up
…and many more.
Screener for Stock Chart Patterns ᐉ Pattern Search Engine (PSE)
You can filter by asset class (Stocks, Penny Stocks, ETFs, Forex) and by confidence level, price range, and other custom settings. The more filters you apply, the fewer but higher-quality trade ideas you receive.
Why the Pattern Search Engine Stands Out
-
Covers 39 pattern types across multiple asset classes
-
AI-generated confidence, breakout, and target metrics
-
Fully customizable filters — price range, asset class, and confidence level
-
Real-time notifications and bookmarking features
-
Free 14-day trial, then just $30/month
-
Powered by Tickeron’s proprietary AI/ML infrastructure and Financial Learning Models (FLMs)
Screener for Stock Chart Patterns ᐉ Pattern Search Engine (PSE)
Product Ecosystem: From Patterns to Real-Time Agents
Tickeron offers a full suite of AI-powered trading tools. Key products include:
- AI Trend Prediction Engine — tickeron.com/stock-tpe/
- AI Pattern Search Engine (PSE) — tickeron.com/stock-pattern-screener/
- AI Real Time Patterns — tickeron.com/stock-pattern-scanner/
- AI Screener — tickeron.com/screener/
- Time Machine in AI Screener — tickeron.com/time-machine/
- Daily Buy/Sell Signals — tickeron.com/buy-sell-signals/
Beyond tools, Tickeron offers automated trading and copy-trading via its AI Robots and trading Agents:
- Bot trading and copy-trading: tickeron.com/bot-trading/
- Copy-Trading: tickeron.com/copy-trading/
- AI-Stock-Trading: tickeron.com/ai-stock-trading/
- AI Agents: tickeron.com/ai-agents/
- Virtual Agents: tickeron.com/bot-trading/virtualagents/all/
- Signal Agents: tickeron.com/bot-trading/signals/all/
- Real-Money Bots: tickeron.com/bot-trading/realmoney/all/
Tickeron’s AI Agents are advanced trading entities that leverage proprietary FLMs and machine-learning intervals (5-, 15- and 60-minute cycles) to deliver precision entries and exits across asset classes. Users can choose from Signal Agents (for alerts), Virtual Agents (simulated portfolios) and Brokerage Agents (live trade integration). With these agents, the company bridges institutional-grade execution with retail accessibility.
Recent Market Context & News
Today’s market is micro-shifting rapidly, and PSE is optimally positioned to capture those changes. For example:
- AMD surged ~31.66% in one week on an OpenAI partnership announcement, with an average daily volume of ~6 million shares. PSE found that in 30 of 37 past instances when AMD’s 50-day moving average was breached, a further rise occurred (~81% odds) via Tickeron’s back-tests. tickeron.com
- According to Tickeron’s blog, AI Robots achieved annualized returns up to +54% on 15-minute models during a recent market rally. tickeron.com
- AI Trading Bots delivered up to +82% annualized returns in volatile markets, showcasing the power of shorter ML intervals of 5 and 15 minutes. tickeron.com
These market movements emphasize the importance of pattern recognition and AI-driven timing — exactly the problem PSE is designed to address.
Pricing and Free Trial
Start your free 14-day trial today at Tickeron.com.
Continue afterward for just $30/month — simple pricing for advanced AI capabilities.
Empowering Traders with AI-Driven Simplicity
The Pattern Search Engine gives traders an elegant yet powerful workflow: continuous scanning, AI-calculated breakout and target levels, confidence metrics, and instant alerts.
Whether trading stocks, ETFs, penny stocks, crypto, or forex, users receive institutional-level pattern insights at retail cost.
By filtering by pattern type, confidence, price range, or asset class, traders focus only on the highest-probability setups — not the noise.
Powered by Financial Learning Models (FLMs)
At the core of PSE lies Tickeron’s Financial Learning Models (FLMs) and Machine Learning Models (MLMs), trained on massive datasets across multiple timeframes (5, 15, and 60 minutes).
These models analyze price action, volume, sentiment, and macro data to detect emerging structures and forecast breakout potential.
Internal tests confirm that shorter ML cycles improve timing accuracy by 20–30%, significantly boosting signal quality.
About Tickeron
Tickeron is a leading AI financial technology company developing intelligent tools for traders and investors.
Powered by proprietary Financial Learning Models (FLMs), Tickeron delivers real-time analytics, pattern recognition, and predictive trading insights across multiple asset classes.
Visit tickeron.com and follow us on Twitter/X at @Tickeron for updates.
Screener for Stock Chart Patterns ᐉ Pattern Search Engine (PSE)
TSLA in downward trend: 10-day moving average crossed below 50-day moving average on November 18, 2025
The 10-day moving average for TSLA crossed bearishly below the 50-day moving average on November 18, 2025. This indicates that the trend has shifted lower and could be considered a sell signal. In of 15 past instances when the 10-day crossed below the 50-day, the stock continued to move higher over the following month. The odds of a continued downward trend are .

Technical Analysis (Indicators)
Bearish Trend Analysis
The Momentum Indicator moved below the 0 level on November 06, 2025. You may want to consider selling the stock, shorting the stock, or exploring put options on TSLA as a result. In of 79 cases where the Momentum Indicator fell below 0, the stock fell further within the subsequent month. The odds of a continued downward trend are .
The Moving Average Convergence Divergence Histogram (MACD) for TSLA turned negative on November 04, 2025. This could be a sign that the stock is set to turn lower in the coming weeks. Traders may want to sell the stock or buy put options. Tickeron's A.I.dvisor looked at 46 similar instances when the indicator turned negative. In of the 46 cases the stock turned lower in the days that followed. This puts the odds of success at .
TSLA moved below its 50-day moving average on November 13, 2025 date and that indicates a change from an upward trend to a downward trend.
Following a 3-day decline, the stock is projected to fall further. Considering past instances where TSLA declined for three days, the price rose further in of 62 cases within the following month. The odds of a continued downward trend are .
Bullish Trend Analysis
The Stochastic Oscillator shows that the ticker has stayed in the oversold zone for 6 days. The price of this ticker is presumed to bounce back soon, since the longer the ticker stays in the oversold zone, the more promptly an upward trend is expected.
Following a 3-day Advance, the price is estimated to grow further. Considering data from situations where TSLA advanced for three days, in of 338 cases, the price rose further within the following month. The odds of a continued upward trend are .
TSLA may jump back above the lower band and head toward the middle band. Traders may consider buying the stock or exploring call options.
The Aroon Indicator entered an Uptrend today. In of 281 cases where TSLA Aroon's Indicator entered an Uptrend, the price rose further within the following month. The odds of a continued Uptrend are .
The Tickeron PE Growth Rating for this company is (best 1 - 100 worst), pointing to outstanding earnings growth. The PE Growth rating is based on a comparative analysis of stock PE ratio increase over the last 12 months compared against S&P 500 index constituents.
The Tickeron Seasonality Score of (best 1 - 100 worst) indicates that the company is fair valued in the industry. The Tickeron Seasonality score describes the variance of predictable price changes around the same period every calendar year. These changes can be tied to a specific month, quarter, holiday or vacation period, as well as a meteorological or growing season.
The Tickeron Price Growth Rating for this company is (best 1 - 100 worst), indicating steady price growth. TSLA’s price grows at a higher rate over the last 12 months as compared to S&P 500 index constituents.
The Tickeron Profit vs. Risk Rating rating for this company is (best 1 - 100 worst), indicating well-balanced risk and returns. The average Profit vs. Risk Rating rating for the industry is 84, placing this stock slightly better than average.
The Tickeron SMR rating for this company is (best 1 - 100 worst), indicating weak sales and an unprofitable business model. SMR (Sales, Margin, Return on Equity) rating is based on comparative analysis of weighted Sales, Income Margin and Return on Equity values compared against S&P 500 index constituents. The weighted SMR value is a proprietary formula developed by Tickeron and represents an overall profitability measure for a stock.
The Tickeron Valuation Rating of (best 1 - 100 worst) indicates that the company is significantly overvalued in the industry. This rating compares market capitalization estimated by our proprietary formula with the current market capitalization. This rating is based on the following metrics, as compared to industry averages: P/B Ratio (16.260) is normal, around the industry mean (3.685). P/E Ratio (269.717) is within average values for comparable stocks, (269.298). TSLA's Projected Growth (PEG Ratio) (7.760) is very high in comparison to the industry average of (2.092). TSLA has a moderately low Dividend Yield (0.000) as compared to the industry average of (0.043). P/S Ratio (14.409) is also within normal values, averaging (24.355).
Notable companies
Industry description
Market Cap
High and low price notable news
Volume
Fundamental Analysis Ratings
The average fundamental analysis ratings, where 1 is best and 100 is worst, are as follows

Advertisement
General Information
a manufacturer of electric sports cars
Industry MotorVehicles
Advertisement