


By 2025, NVDA/SOXS AI Trading Double Agent Will Have a +114% Return
In the rapidly evolving world of financial markets, artificial intelligence (AI) continues to redefine trading strategies. Tickeron’s AI Trading Double Agent, focusing on NVIDIA Corporation (NVDA) and the Direxion Daily Semiconductor Bear 3X Shares (SOXS), has delivered an impressive annualized return of +114% using a 15-minute timeframe strategy in 2025. This article explores the performance, mechanics, and market context of this AI-driven trading strategy, highlighting its effectiveness in navigating volatile markets and leveraging inverse ETFs for balanced risk management.
Harnessing AI for Superior Trading Performance
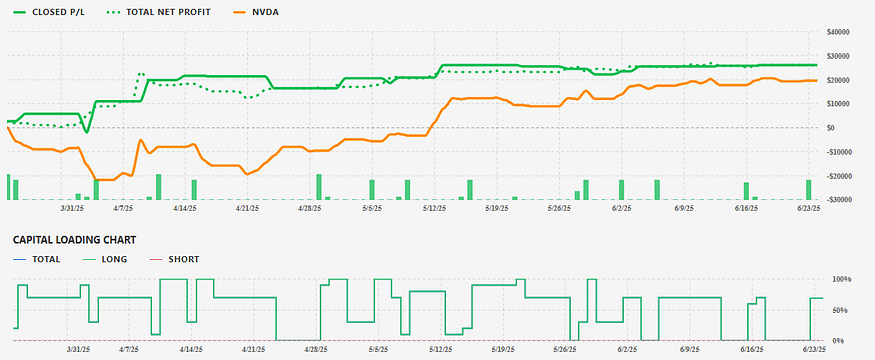
The NVDA/SOXS AI Trading Double Agent employs Tickeron’s cutting-edge Financial Learning Models (FLMs) to analyze market patterns and execute trades with precision. Operating on a 15-minute chart, the strategy dynamically switches between bullish positions in NVDA, a leader in AI and semiconductor technology, and bearish positions in SOXS, a leveraged inverse ETF that tracks three times the inverse performance of the ICE Semiconductor Index. This approach capitalizes on NVDA’s high volatility — evidenced by a 44% decline from $153 to $86 earlier in 2025 — and SOXS’s ability to profit from semiconductor sector downturns. The strategy’s +114% annualized return reflects a 68% profitable trade rate, showcasing its ability to adapt to rapid market shifts.
Market Context: June 23, 2025
On June 23, 2025, financial markets experienced notable movements influenced by geopolitical and economic developments. According to CNBC, stocks rose as oil prices declined following Iran’s restrained response to U.S. military actions, providing a stable backdrop for equity markets. However, Yahoo Finance reported a 0.2% slip in the S&P 500 and a 0.5% drop in the Nasdaq Composite, driven by uncertainties around Federal Reserve rate decisions and potential U.S. involvement in the Israel-Iran conflict. Chip stocks, including NVDA, faced pressure after a Wall Street Journal report highlighted U.S. plans to revoke waivers for semiconductor manufacturers accessing American technology in China, leading to a 1.1% decline in NVDA’s stock price. These dynamics underscore the volatility that Tickeron’s AI Trading Double Agent navigates effectively.
The Power of Trading with Inverse ETFs
Pairing a stock like NVDA with an inverse ETF such as SOXS offers a strategic advantage due to their near-perfect negative correlation. SOXS, designed to deliver three times the inverse daily performance of the semiconductor sector, acts as a hedge against downturns in NVDA and other chip stocks. When NVDA declines, SOXS typically rises, allowing the AI Double Agent to profit from bearish market moves while maintaining bullish exposure during uptrends. This balanced approach mitigates risk and enhances returns, as demonstrated by the strategy’s +114% annualized return. By leveraging SOXS as a volatility buffer, traders can capitalize on sector swings without being overly exposed to directional risk.
Comparison with a Highly Correlated Stock: TSM
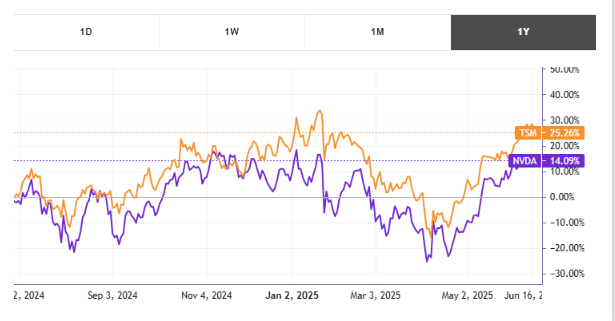
To contextualize the NVDA/SOXS strategy, consider its performance relative to a similar AI-driven strategy pairing Taiwan Semiconductor Manufacturing Company (TSM) with SOXS. According to Tickeron, the TSM/SOXS Double Agent achieved a +104% annualized return in 2025, slightly underperforming the NVDA/SOXS strategy. Both stocks are highly correlated, with NVDA and TSM sharing a correlation coefficient of approximately 0.85 due to their prominence in the semiconductor sector. However, NVDA’s higher beta (1.68 vs. TSM’s 1.42) makes it more volatile, enabling the NVDA/SOXS strategy to capture larger price swings. While TSM offers stability as a global chip manufacturing leader, NVDA’s dominance in AI-driven GPU markets gives the NVDA/SOXS strategy an edge in high-volatility environments.
Tickeron’s AI Trading Agents: A Game-Changer
Tickeron’s AI Trading Agents, powered by advanced Financial Learning Models (FLMs), are revolutionizing algorithmic trading. Under the leadership of CEO Sergey Savastiouk, Tickeron has developed user-friendly trading bots that cater to both novice and experienced traders. These bots combine real-time market analytics with technical analysis to deliver actionable insights. The NVDA/SOXS Double Agent exemplifies this innovation, using AI to detect short-term trends and execute trades with high precision. On June 17, 2025, Tickeron’s FLMs achieved annualized returns ranging from +250% to +362% across various assets, highlighting their transformative impact. By offering transparency and control, Tickeron empowers traders to navigate complex markets with confidence.
Statistical Insights and Performance Metrics
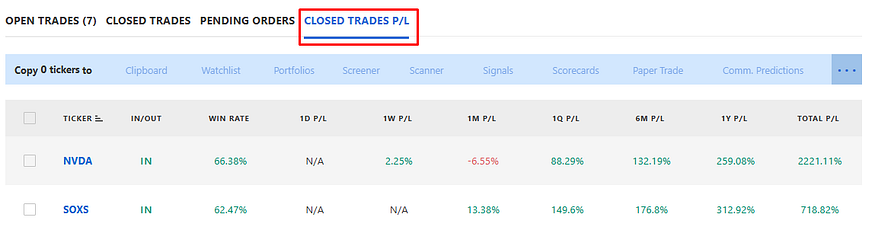
The NVDA/SOXS AI Trading Double Agent’s performance is underpinned by robust statistics. As of June 23, 2025, the strategy recorded a +114% annualized return with a 68% win rate across trades executed on a 15-minute timeframe. NVDA’s stock price, despite a 44% drop earlier in the year, rebounded to a market capitalization of $3.46 trillion, driven by a 70% year-over-year revenue growth fueled by AI demand. Meanwhile, SOXS experienced amplified volatility, with a year-to-date performance of -50.63%, reflecting its 3x leverage decay. The strategy’s success lies in its ability to balance NVDA’s bullish momentum — supported by analyst price targets of $200 from Barclays — with SOXS’s bearish opportunities, achieving consistent gains in a turbulent market.
AI Robots (Signal Agents)
AI Robots and P/L
NVDA / SOXS — Trading Results AI Trading Double Agent, 15min +262.27%
NVDA / NVDS Trading Results AI Trading Double Agent, 60 min +95.69%
Swing Trader, Popular Stocks: Price Action Trading Strategy — Pro Version (TA&FA), 60 min +17.01%
AI Robots (Virtual Agents)
AI Robots and P/L
NVDA / NVDS Trading Results AI Trading Double Agent, 60 min +95.84%
Swing Trader: Search for Dips in Top 10 Giants (TA), 60 min +40.95%
Swing Trader: Tracking Dip Trends in Industrial Stocks (TA) — Trading Results, 60 min +15.84%
AI Robots (Signal Agents)
AI Robots and P/L
TSM / SOXS Trading Results AI Trading Double Agent, 60min +186.14%
AI Robots (Virtual Agents)
AI Robots and P/L
TSM Trading Results AI Trading Agent, 60 min +441.80%
TSM / SOXS Trading Results AI Trading Double Agent, 60 min +186.11%
Swing Trader: Search for Dips in Top 10 Giants (TA), 60 min +83.93%
Stock price — (NVDA: $144.17 vs. TSM: $210.32)
Brand notoriety: NVDA and TSM are both notable
Both companies represent the semiconductor industry
Current volume relative to the 65-day Moving Average: NVDA: 75% vs. TSM: 63%
Market capitalization — NVDA: $3.51T vs. TSM: $893.58B
NVDA [Semiconductors] is valued at $3.51T. TSM’s [Semiconductors] market capitalization is $ 893.58 B. The market cap for tickers in the [Semiconductors] industry ranges from $3.51T to $0. The average market capitalization across the [Semiconductors] industry is $ 55.79 B.
Long-Term Analysis
It is best to consider a long-term outlook for a ticker by using Fundamental Analysis (FA) ratings. The rating of 1 to 100, where 1 is best and 100 is worst, is divided into thirds. The first third (a green rating of 1–33) indicates that the ticker is undervalued; the second third (a grey number between 34 and 66) means that the ticker is valued fairly; and the last third (red number of 67 to 100) reflects that the ticker is undervalued. We use an FA Score to show how many ratings show the ticker to be undervalued (green) or overvalued (red).
NVDA’s FA Score shows that 3 FA ratings are green, while TSM’s FA Score has 2 green FA ratings.
- NVDA’s FA Score: 3 green, 2 red.
- TSM’s FA Score: 2 green, 3 red.
According to our system of comparison, TSM is a better buy in the long term than NVDA.
Short-Term Analysis
It is best to consider a short-term outlook for a ticker by using Technical Analysis (TA) indicators. We use Odds of Success as the percentage of outcomes that confirm successful trade signals in the past.
If the Odds of Success (the likelihood of the continuation of a trend) for each indicator are greater than 50%, then the generated signal is confirmed. A green percentage from 90% to 51% indicates that the ticker is in a bullish trend. A red percentage from 90% to 51% indicates that the ticker is in a bearish trend. All grey percentages are below 50% and are considered not to confirm the trend signal.
NVDA’s TA Score shows that 2 TA indicators are bullish, while TSM’s TA Score has 3 bullish TA indicators.
- NVDA’s TA Score: 2 bullish, 4 bearish.
- TSM’s TA Score: 3 bullish, 5 bearish.
According to our system of comparison, both NVDA and TSM are a bad buy in the short term.
Price Growth
NVDA (Semiconductors) experienced а +1.55% price change this week, while TSM (Semiconductors) price change was -2.49% for the same time period.
The average weekly price growth across all stocks in the @Semiconductors industry was -0.69%. For the same industry, the average monthly price growth was +8.00%, and the average quarterly price growth was -5.85%.
Reported Earnings Dates
NVDA is expected to report earnings on Aug 27, 2025.
TSM is expected to report earnings on Jul 17, 2025.
Industries’ Descriptions
Semiconductors (-0.69% weekly)
The semiconductor industry manufacturers all chip-related products, including research and development. These chips are used in innumerable electronic devices, including computers, cell phones, smartphones, and GPSs. Intel Corporation, NVIDIA Corp., and Broadcom are some of the prominent players in this industry. Semiconductor companies usually tend to do well during periods of healthy economic growth, thereby inducing further research and development in the industry, which in turn augurs well for productivity and growth in the economy. In the near future, demand for semiconductor products (and possibly innovation within the segment) should only expand further, with the proliferation of 5G, autonomous vehicles, IoT, and various AI-driven electronics set to herald a new, advanced chapter in the technology-driven world as we know it. With burgeoning prospects comes great competition. In 2015, SIA estimated that the U.S. semiconductor industry ranks as the second most competitive U.S. industry out of 2882 U.S. industries designated manufacturers by the U.S. Census Bureau.
Conclusion: AI-Driven Trading in 2025
The NVDA/SOXS AI Trading Double Agent, with its +114% annualized return, underscores the power of Tickeron’s AI-driven strategies in 2025’s volatile markets. By leveraging NVDA’s growth potential and SOXS’s inverse exposure, the strategy delivers balanced risk-reward dynamics. Market events on June 23, 2025, including geopolitical tensions and semiconductor sector pressures, highlight the importance of adaptive AI tools. As Tickeron continues to innovate with its AI Trading Agents, traders have unprecedented opportunities to capitalize on market movements, making strategies like NVDA/SOXS a cornerstone of modern algorithmic trading.
NVDA in downward trend: price dove below 50-day moving average on September 02, 2025
NVDA moved below its 50-day moving average on September 02, 2025 date and that indicates a change from an upward trend to a downward trend. In of 36 similar past instances, the stock price decreased further within the following month. The odds of a continued downward trend are .

Technical Analysis (Indicators)
Bearish Trend Analysis
The Momentum Indicator moved below the 0 level on August 28, 2025. You may want to consider selling the stock, shorting the stock, or exploring put options on NVDA as a result. In of 82 cases where the Momentum Indicator fell below 0, the stock fell further within the subsequent month. The odds of a continued downward trend are .
Following a 3-day decline, the stock is projected to fall further. Considering past instances where NVDA declined for three days, the price rose further in of 62 cases within the following month. The odds of a continued downward trend are .
Bullish Trend Analysis
The RSI Indicator entered the oversold zone -- be on the watch for NVDA's price rising or consolidating in the future. That's also the time to consider buying the stock or exploring call options.
The Stochastic Oscillator demonstrated that the ticker has stayed in the oversold zone for 2 days, which means it's wise to expect a price bounce in the near future.
Following a 3-day Advance, the price is estimated to grow further. Considering data from situations where NVDA advanced for three days, in of 365 cases, the price rose further within the following month. The odds of a continued upward trend are .
NVDA may jump back above the lower band and head toward the middle band. Traders may consider buying the stock or exploring call options.
The Aroon Indicator entered an Uptrend today. In of 341 cases where NVDA Aroon's Indicator entered an Uptrend, the price rose further within the following month. The odds of a continued Uptrend are .
The Tickeron Profit vs. Risk Rating rating for this company is (best 1 - 100 worst), indicating low risk on high returns. The average Profit vs. Risk Rating rating for the industry is 81, placing this stock better than average.
The Tickeron SMR rating for this company is (best 1 - 100 worst), indicating very strong sales and a profitable business model. SMR (Sales, Margin, Return on Equity) rating is based on comparative analysis of weighted Sales, Income Margin and Return on Equity values compared against S&P 500 index constituents. The weighted SMR value is a proprietary formula developed by Tickeron and represents an overall profitability measure for a stock.
The Tickeron Price Growth Rating for this company is (best 1 - 100 worst), indicating steady price growth. NVDA’s price grows at a higher rate over the last 12 months as compared to S&P 500 index constituents.
The Tickeron PE Growth Rating for this company is (best 1 - 100 worst), pointing to average earnings growth. The PE Growth rating is based on a comparative analysis of stock PE ratio increase over the last 12 months compared against S&P 500 index constituents.
The Tickeron Valuation Rating of (best 1 - 100 worst) indicates that the company is significantly overvalued in the industry. This rating compares market capitalization estimated by our proprietary formula with the current market capitalization. This rating is based on the following metrics, as compared to industry averages: NVDA's P/B Ratio (40.650) is slightly higher than the industry average of (10.960). P/E Ratio (47.584) is within average values for comparable stocks, (71.060). Projected Growth (PEG Ratio) (1.245) is also within normal values, averaging (1.800). NVDA has a moderately low Dividend Yield (0.000) as compared to the industry average of (0.022). P/S Ratio (24.938) is also within normal values, averaging (27.791).
Notable companies
Industry description
Market Cap
High and low price notable news
Volume
Fundamental Analysis Ratings
The average fundamental analysis ratings, where 1 is best and 100 is worst, are as follows


Advertisement
General Information
a manufacturer of computer graphics processors, chipsets, and related multimedia software
Industry Semiconductors
Advertisement