


Nasdaq's (NDAQ) July 16, 2025, earnings preview: The stock rises 7.67% thanks to positive technicals.
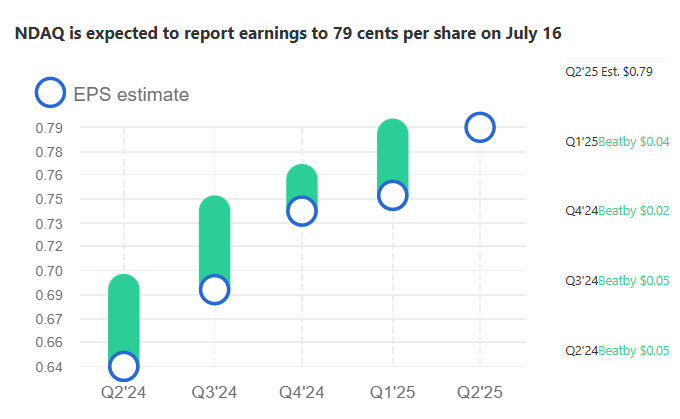
Nasdaq, Inc. (NASDAQ: NDAQ), a leading global technology company operating the Nasdaq Stock Market, is set to release its earnings report on July 16, 2025, with analysts anticipating earnings of $0.79 per share. This follows an impressive first-quarter performance in 2025, where Nasdaq reported earnings per share of $0.79, surpassing consensus estimates of $0.77 by $0.02, and revenue of $1.24 billion, exceeding expectations of $1.22 billion. The company achieved a 12.5% year-over-year increase in net revenue, driven by robust growth in its solutions segment and a 17% rise in operating income. With a net margin of 16.36% and a return on equity of 15.38%, Nasdaq demonstrates strong financial health, positioning it well for its upcoming report.
Recent Stock Performance: A 7.67% Surge
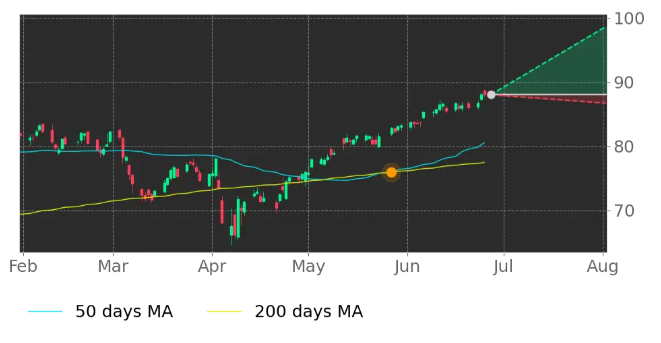
Nasdaq’s stock has shown significant momentum, gaining 7.67% in June 2025, with an average daily trading volume of 3 million shares. On June 24, 2025, the stock hit a new 52-week high of $87.81, closing at $87.55, up from $86.73 the previous day. This performance reflects strong investor confidence, bolstered by positive analyst ratings and market developments. The stock’s 50-day moving average of $80.59 has recently crossed bullishly above its 200-day moving average of $78.77, signaling potential for continued upward momentum. This technical indicator, known as a “golden cross,” is often viewed by traders as a bullish signal, suggesting sustained price appreciation.
Bullish Technical Indicators and Market Sentiment
Golden Cross Signals Upward Trend
The bullish crossover of Nasdaq’s 50-day moving average above its 200-day moving average is a significant technical event. This “golden cross” typically indicates a shift in momentum, with the shorter-term average reflecting recent price strength overtaking the longer-term trend. Historical data from Tickeron.com shows that such crossovers often precede sustained price increases, particularly for stocks with strong fundamentals like Nasdaq. The stock’s high liquidity, with a daily trading volume of 3 million shares, further supports its attractiveness to both institutional and retail investors.
Analyst Upgrades Fuel Optimism
Analyst sentiment has been overwhelmingly positive, with several firms raising price targets. Oppenheimer increased its target from $85.00 to $96.00 with an “outperform” rating on June 20, 2025, while Redburn Atlantic upgraded Nasdaq to a “buy” rating with a $91.00 target on April 17, 2025. Keefe, Bruyette & Woods also raised their target to $88.00, maintaining an “outperform” rating. These upgrades reflect confidence in Nasdaq’s growth trajectory, driven by its diversified revenue streams and technological advancements.
Market News Impacting Nasdaq on June 25, 2025
The broader market on June 25, 2025, showed mixed performance, with the S&P 500 closing flat at 6,092.16, while the Nasdaq Composite gained 0.31% to 19,973.55. The Nasdaq 100 index hit an all-time high of $22,329, driven by strength in technology stocks, particularly AI-related companies like Nvidia and Microsoft, which also reached record highs. A ceasefire between Israel and Iran, effective June 24, 2025, contributed to positive market sentiment by easing geopolitical tensions. However, concerns about trade policy and tariff uncertainties persisted, with some analysts noting potential cyclical headwinds despite secular tailwinds from AI and technological innovation. Nasdaq’s stock benefited from this tech-driven rally, aligning with the broader Nasdaq 100’s record-setting performance.
Tickeron’s AI-Driven Trading Patterns
Leveraging Patterns for Trading Success
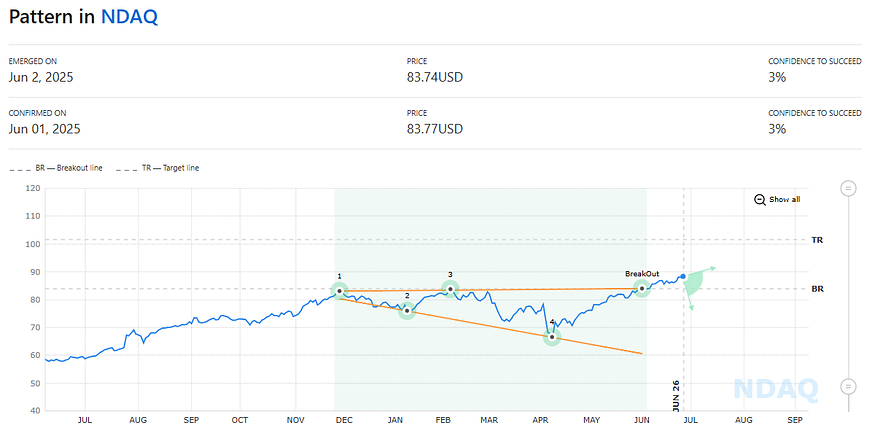
Tickeron.com provides advanced tools for identifying trading patterns, which are critical for traders seeking to capitalize on Nasdaq’s recent momentum. Popular technical patterns, such as the “golden cross” observed in NDAQ’s moving averages, are integrated into Tickeron’s Financial Learning Models (FLMs). These models combine technical analysis with AI to detect patterns with up to 86.6% win rates in high-liquidity stocks like NDAQ. For example, traders can use patterns like the “Bullish Engulfing” or “Breakout Above Resistance” to time entries, particularly when confirmed by high trading volume. Tickeron’s platform also supports pattern-based trading strategies, enabling users to automate trades based on these signals, enhancing efficiency and precision.
Popular Patterns for NDAQ
For NDAQ, key patterns to watch include the “Ascending Triangle,” which often signals a breakout when prices push above a resistance level, and the “Relative Strength Index (RSI) Divergence,” which can indicate overbought or oversold conditions. As of June 25, 2025, NDAQ’s RSI is approaching 70, suggesting strong momentum but nearing overbought territory. Traders using Tickeron’s tools can set alerts for these patterns, leveraging real-time AI insights to optimize trade execution. The platform’s high-liquidity stock robots ensure seamless order placement, critical for a stock with NDAQ’s trading volume. Explore Tickeron’s pattern-based trading tools.
Tickeron’s AI Trading Robots and Double Agents
Tickeron.com has revolutionized trading through its AI Trading Robots and Double Agents, offering sophisticated tools for both novice and experienced investors. These robots analyze market data in real-time, identifying bullish and bearish signals to provide a balanced perspective. For NDAQ, Tickeron’s Double Agents can highlight opportunities during pullbacks or confirm bullish trends like the recent golden cross. Designed for accessibility, these tools allow beginners to engage with complex strategies while offering advanced traders granular control. By integrating machine learning, Tickeron’s robots adapt to changing market conditions, making them ideal for navigating NDAQ’s volatility around its earnings release. Visit Tickeron’s AI Trading Robots page for more details.
AI Robots (Signal Agents)
AI Robot and P/L
NDAQ — Trading Results AI Trading Agent, 15min +1174.58%
Financial Health and Strategic Initiatives
Robust Financial Metrics
Nasdaq’s financial stability is underscored by its quick and current ratios of 0.98, indicating solid liquidity, and a debt-to-equity ratio of 0.77, reflecting a balanced capital structure. The company’s dividend policy further enhances its appeal, with a quarterly dividend of $0.27 per share, payable on June 27, 2025, yielding 1.25% annually. This represents an increase from the prior $0.24, signaling confidence in sustained cash flows. With a market capitalization of $49.75 billion and trading near its 52-week high of $87.81, Nasdaq remains a compelling investment.
Blockchain and Technology Advancements
On June 26, 2025, Nasdaq announced the launch of a 24/7 blockchain-based collateral management system integrated with its Calypso platform, a first in the industry. This innovation connects traditional and digital assets, serving 97% of global systematically important banks and 3,800+ financial clients. Such advancements position Nasdaq as a leader in financial technology, potentially driving further revenue growth and supporting its stock’s bullish outlook.
Risks and Considerations
Despite its strong performance, Nasdaq faces risks from macroeconomic uncertainties, including potential tariff impacts and policy shifts following the U.S. Presidential Election in November 2024. Short interest in Nasdaq securities increased to 15.82 billion shares as of April 15, 2025, indicating some bearish sentiment. Traders should monitor for signs of over-leverage, as highlighted by posts on X, which could trigger sell-offs if sentiment shifts. Using Tickeron’s AI tools to hedge with inverse ETFs or monitor RSI can mitigate these risks.
Conclusion: A Bullish Outlook for NDAQ
Nasdaq, Inc. (NDAQ) is poised for a strong earnings report on July 16, 2025, with analysts expecting $0.79 per share, supported by robust Q1 results and a 7.67% stock price surge in June. The bullish golden cross, high trading volume, and positive analyst upgrades underscore its momentum. Tickeron’s AI-driven tools, including Financial Learning Models and Trading Robots, offer traders powerful resources to capitalize on NDAQ’s patterns, such as the golden cross or ascending triangle. However, investors should remain vigilant of macroeconomic risks and leverage platforms like Tickeron.com for real-time insights. With its technological innovations and strong fundamentals, NDAQ remains a standout in the financial services sector.
NDAQ in upward trend: price rose above 50-day moving average on November 24, 2025
NDAQ moved above its 50-day moving average on November 24, 2025 date and that indicates a change from a downward trend to an upward trend. In of 32 similar past instances, the stock price increased further within the following month. The odds of a continued upward trend are .

Technical Analysis (Indicators)
Bullish Trend Analysis
The Stochastic Oscillator suggests the stock price trend may be in a reversal from a downward trend to an upward trend. of 44 cases where NDAQ's Stochastic Oscillator exited the oversold zone resulted in an increase in price. Tickeron's analysis proposes that the odds of a continued upward trend are .
The Momentum Indicator moved above the 0 level on November 19, 2025. You may want to consider a long position or call options on NDAQ as a result. In of 80 past instances where the momentum indicator moved above 0, the stock continued to climb. The odds of a continued upward trend are .
The Moving Average Convergence Divergence (MACD) for NDAQ just turned positive on November 20, 2025. Looking at past instances where NDAQ's MACD turned positive, the stock continued to rise in of 40 cases over the following month. The odds of a continued upward trend are .
Following a 3-day Advance, the price is estimated to grow further. Considering data from situations where NDAQ advanced for three days, in of 368 cases, the price rose further within the following month. The odds of a continued upward trend are .
NDAQ may jump back above the lower band and head toward the middle band. Traders may consider buying the stock or exploring call options.
Bearish Trend Analysis
Following a 3-day decline, the stock is projected to fall further. Considering past instances where NDAQ declined for three days, the price rose further in of 62 cases within the following month. The odds of a continued downward trend are .
The Aroon Indicator for NDAQ entered a downward trend on November 24, 2025. This could indicate a strong downward move is ahead for the stock. Traders may want to consider selling the stock or buying put options.
The Tickeron Profit vs. Risk Rating rating for this company is (best 1 - 100 worst), indicating low risk on high returns. The average Profit vs. Risk Rating rating for the industry is 62, placing this stock better than average.
The Tickeron Price Growth Rating for this company is (best 1 - 100 worst), indicating steady price growth. NDAQ’s price grows at a higher rate over the last 12 months as compared to S&P 500 index constituents.
The Tickeron SMR rating for this company is (best 1 - 100 worst), indicating slightly weaker than average sales and a marginally profitable business model. SMR (Sales, Margin, Return on Equity) rating is based on comparative analysis of weighted Sales, Income Margin and Return on Equity values compared against S&P 500 index constituents. The weighted SMR value is a proprietary formula developed by Tickeron and represents an overall profitability measure for a stock.
The Tickeron Valuation Rating of (best 1 - 100 worst) indicates that the company is fair valued in the industry. This rating compares market capitalization estimated by our proprietary formula with the current market capitalization. This rating is based on the following metrics, as compared to industry averages: P/B Ratio (4.234) is normal, around the industry mean (5.395). P/E Ratio (31.836) is within average values for comparable stocks, (28.671). Projected Growth (PEG Ratio) (1.393) is also within normal values, averaging (3.210). Dividend Yield (0.011) settles around the average of (0.024) among similar stocks. P/S Ratio (6.325) is also within normal values, averaging (12.361).
The Tickeron PE Growth Rating for this company is (best 1 - 100 worst), pointing to worse than average earnings growth. The PE Growth rating is based on a comparative analysis of stock PE ratio increase over the last 12 months compared against S&P 500 index constituents.
Notable companies
Industry description
Market Cap
High and low price notable news
Volume
Fundamental Analysis Ratings
The average fundamental analysis ratings, where 1 is best and 100 is worst, are as follows

Advertisement
General Information
an operator of stock exchanges
Industry FinancialPublishingServices
Advertisement