


Review of the Week (June 9–13): Financial Leaders
Overview
The week of June 9-13, 2025, was characterized by significant market volatility driven by both positive developments in US-China trade relations and escalating geopolitical tensions in the Middle East. Early in the week, markets showed optimism as the S&P 500 (SPY) traded above the 6,000 mark and US-China trade negotiations progressed positively. However, by week's end, a dramatic shift occurred as Israel launched strikes against Iran's nuclear facilities, triggering a global risk-off response that sent equity futures plunging and safe-haven assets soaring. This week highlighted the market's sensitivity to both diplomatic breakthroughs and geopolitical shocks, creating a complex landscape for investors navigating between economic data, corporate developments, and international relations.
Financial Markets Weekly Recap
Equities
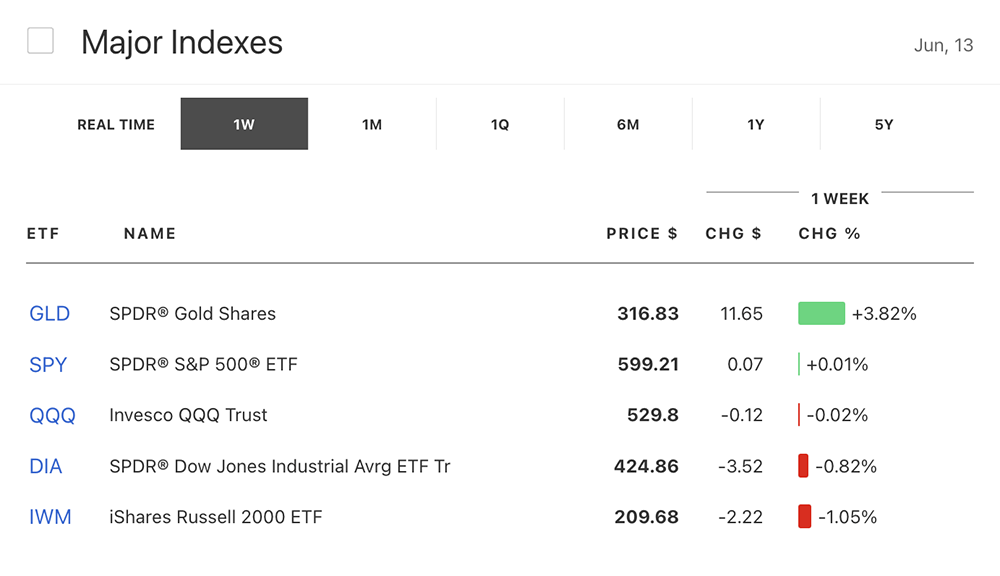
Market Indices: The S&P 500 (SPY) showed resilience early in the week, trading above 6,000 for the first time since February, but faced pressure as geopolitical tensions escalated. The Nasdaq Composite (QQQ) initially eked out small gains as investors awaited developments in US-China trade talks, but futures plunged 2% following the Israel-Iran conflict escalation. The Dow futures (DIA) fell approximately 500 points or 1.17% in response to the Middle East tensions.
Sector Performance: Energy stocks surged following the Israel-Iran conflict, with major oil companies like Chevron (CVX) and Exxon (XOM) climbing nearly 3% in premarket trading as crude prices spiked. Defense stocks also saw significant gains, with Lockheed Martin (LMT) rising 4.7% and Northrop Grumman (NOC) increasing by 4.2%. Conversely, airline stocks fell on concerns about higher fuel costs, with Delta Air Lines (DAL) decreasing by 3% and United Airlines (UAL) dropping by 4%.
Corporate Highlights:
- Tesla (TSLA): Shares surged 5.7% to close at $326.09 on Tuesday as CEO Elon Musk announced June 22 as the tentative launch date for the company's robotaxi service in Austin, Texas. The stock has nearly recovered from its 14% single-day slide following Musk's public dispute with President Trump.
- GameStop (GME): The stock plummeted 22% after reporting Q1 results showing a 17% year-over-year revenue decline to $732.4 million, missing estimates of $754.2 million. Despite the revenue miss, the company posted a net profit of $44.8 million, reversing a $32.3 million loss from the prior year.
- Meta (META): The company announced a $14.3 billion investment in Scale AI, valuing the startup at over $29 billion, and recruited Scale's CEO Alexandr Wang to join Meta's team developing "superintelligence". The move reflects CEO Mark Zuckerberg's push to revive AI efforts at the company as it faces competition from rivals like Google and OpenAI.
- Apple (AAPL): The stock remained steady ahead of its annual Worldwide Developers Conference (WWDC), where the company was expected to announce major updates for its iPhone, Mac, iPad, and other platforms.
Currencies
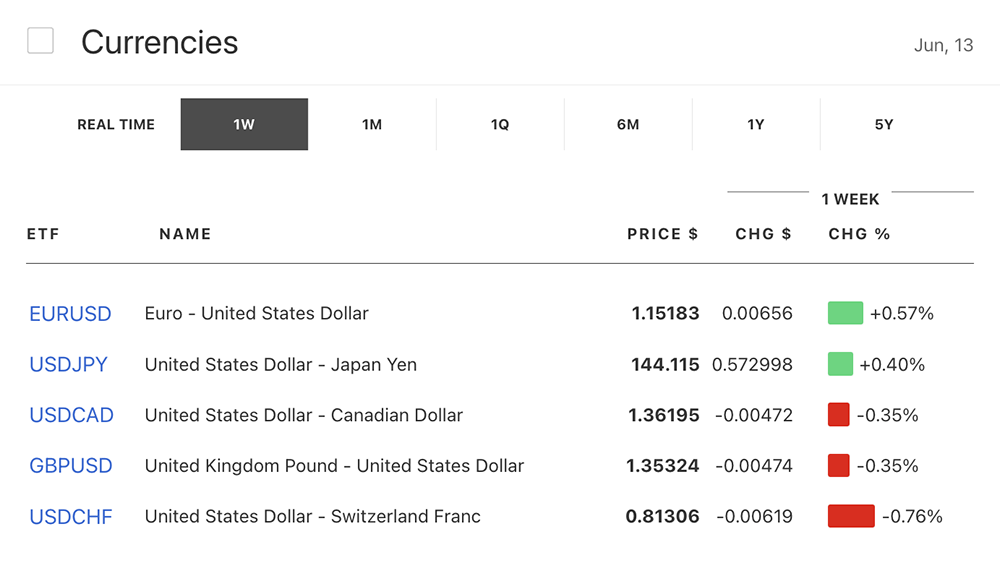
US Dollar: The dollar index fell below 98 for the first time in three years early in the week as trade tensions eased, but strengthened later as investors sought safe-haven assets amid Middle East tensions.
EUR/USD: The euro briefly crossed above $1.16 before retreating as geopolitical tensions increased, with the pair dropping half a percent following the Israel-Iran conflict.
GBP/USD: Sterling hit a sell wall at $1.36 after UK GDP data showed a surprising 0.3% contraction in April, worse than the expected 0.1% decline. The pound slid about 40 pips immediately following the data release, marking the steepest monthly economic decline since 2023.
USD/JPY: The Japanese yen strengthened after Japan's Q1 GDP was revised to flat (0.0%) from a preliminary estimate of -0.2% contraction, outperforming expectations and potentially supporting the case for additional rate hikes by the Bank of Japan.
Commodities
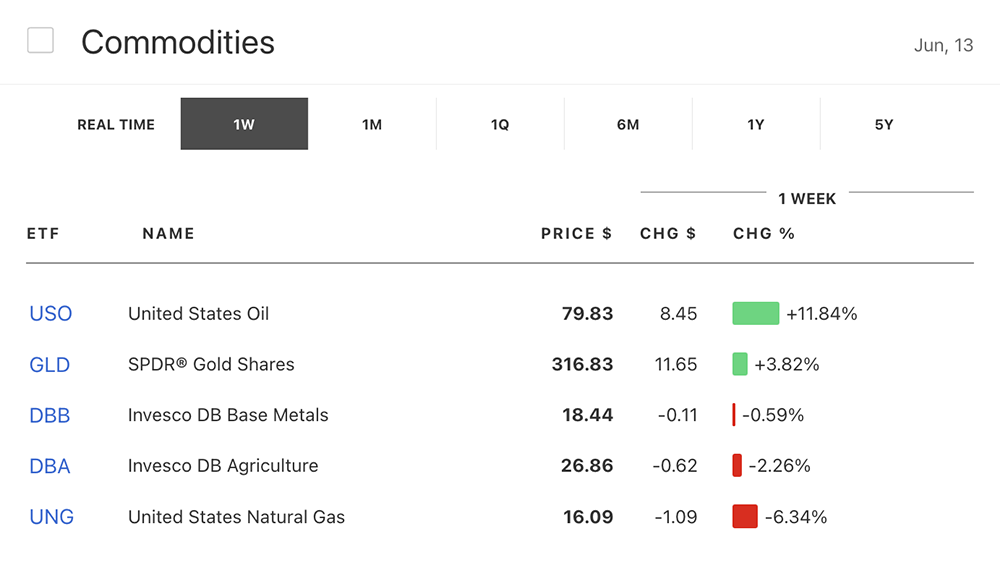
Gold (XAU/USD): Gold prices rallied sharply to $3,440 per ounce as investors rushed to safety following Israel's strikes on Iran's nuclear facilities. The precious metal reaffirmed its status as the ultimate crisis hedge amid the escalating Middle East tensions.
Oil: Brent crude futures (BNO) surged by over 6% following Israel's military action against Iran, reflecting concerns about potential supply disruptions in the oil-rich region.
Cryptocurrencies
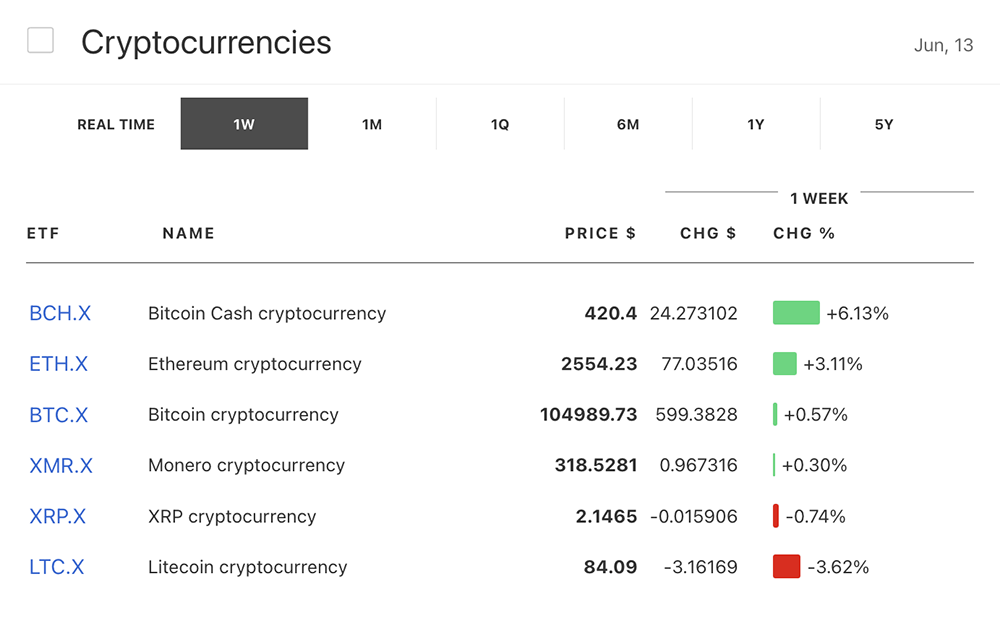
Bitcoin (BTC/USD): Bitcoin prices slid for the third consecutive day, trading below $105,000 and down from recent highs near $112,000. The cryptocurrency dropped nearly 1.6% over 24 hours as broader risk sentiment weakened following the Israel-Iran conflict.
Ethereum (ETH/USD): The second-largest cryptocurrency showed relative weakness, retracing from $2,860 to $2,500 and breaking below recent support at $2,640.
Economic Indicators and Policy Developments
US Inflation: The Consumer Price Index for May rose 2.4% on an annual basis, below the expected 2.5% and slightly up from April's 2.3%. Core inflation, excluding volatile food and energy prices, rose by 2.8% over the past 12 months, also below the forecast of 2.9%. The lower-than-expected inflation was partly due to a sharp 12% year-over-year drop in gasoline prices.
UK Economic Data: The UK economy contracted by 0.3% month-over-month in April, worse than the expected 0.1% decline and a significant reversal from March's 0.2% growth. The Office for National Statistics reported that the contraction was partly due to a sharp decrease in exports to the US amid the imposition of tariffs.
Japan GDP: Japan's Q1 GDP was revised to flat (0.0%) from a preliminary estimate of -0.2% contraction, outperforming expectations. Private consumption was revised slightly higher to a 0.1% gain, while business investment expanded by 1.1%, the fastest pace since Q2 2024.
US-China Trade Deal: President Trump announced that China has agreed to provide American firms with magnets and rare earth elements as part of a new trade framework finalized after two days of negotiations in London. The deal brought Trump's tariffs on Chinese products down from 145% to 30%, while Beijing slashed levies on US imports to 10%.
Geopolitical Developments
Israel-Iran Conflict: In the early hours of June 13, Israel launched large-scale strikes targeting Iranian nuclear facilities and military infrastructure, codenamed "Operation Rising Lion". The attacks, which included over 200 Israeli aircraft dropping more than 330 munitions on around 100 targets, killed several high-ranking Iranian military officials and damaged key nuclear sites. The operation came after the International Atomic Energy Agency found Iran non-compliant with its nuclear obligations for the first time in 20 years.
US-China Relations: Beyond the trade agreement, tensions remained over technology and security issues. The deal came after China had imposed export controls on seven rare earth elements in April, creating significant challenges for global manufacturers, especially in the automotive sector.
Tickeron: Advancing AI-Driven Trading Solutions
Tickeron is a technology company specializing in artificial intelligence applications for financial markets. Founded by a team of Ph.D. mathematicians and quantitative analysts, the company has developed a suite of AI-powered tools designed to enhance trading strategies through data-driven insights.
Central to Tickeron's offerings are its Financial Learning Models (FLMs), which integrate technical indicators, chart patterns, and fundamental data to generate predictive analytics. These models underpin various products, including:
- AI Agents: Automated trading agents that execute strategies based on predefined criteria.
- Pattern Search Engine: Identifies technical patterns in real-time to inform trading decisions.
- Trend Prediction Engine: Forecasts market trends using machine learning algorithms.
To address risk management, Tickeron has introduced Virtual Accounts (VAs), which allow for adjustable trading parameters such as balance, position size, and hedging strategies. These features aim to provide a controlled environment for strategy testing and refinement.
Tickeron's platform is designed to cater to various trading styles, offering tools that support both technical and fundamental analysis. By leveraging AI, the company seeks to provide scalable solutions that adapt to the evolving dynamics of financial markets.
Market Outlook
As markets head into next week, investors will be closely watching several key developments:
- Geopolitical Tensions: The market response to the Israel-Iran conflict will be critical, with particular attention to any Iranian retaliation and its potential impact on oil prices and global risk sentiment.
- Federal Reserve Meeting: The upcoming Fed meeting will be closely watched for interest rate decisions and guidance on future policy, with markets currently anticipating that policymakers will maintain current rates.
- US-China Trade Implementation: Markets will monitor the implementation of the new US-China trade framework, particularly the resumption of rare earth exports to the United States.
- UK Monetary Policy: Following disappointing GDP data, the Bank of England's upcoming monetary policy meeting and UK CPI data for May will be crucial in determining the path of interest rates, with current expectations that the BoE will pause rate cuts and keep the benchmark at 4.25%.
The week's events have created a complex landscape for investors, with positive developments in trade and inflation data counterbalanced by serious geopolitical risks. This environment suggests continued volatility as markets navigate between economic fundamentals and geopolitical uncertainties in the coming weeks.
Momentum Indicator for SPY turns positive, indicating new upward trend
SPY saw its Momentum Indicator move above the 0 level on November 28, 2025. This is an indication that the stock could be shifting in to a new upward move. Traders may want to consider buying the stock or buying call options. Tickeron's A.I.dvisor looked at 73 similar instances where the indicator turned positive. In of the 73 cases, the stock moved higher in the following days. The odds of a move higher are at .

Technical Analysis (Indicators)
Bullish Trend Analysis
The RSI Indicator points to a transition from a downward trend to an upward trend -- in cases where SPY's RSI Oscillator exited the oversold zone, of 22 resulted in an increase in price. Tickeron's analysis proposes that the odds of a continued upward trend are .
The Moving Average Convergence Divergence (MACD) for SPY just turned positive on November 28, 2025. Looking at past instances where SPY's MACD turned positive, the stock continued to rise in of 54 cases over the following month. The odds of a continued upward trend are .
SPY moved above its 50-day moving average on November 25, 2025 date and that indicates a change from a downward trend to an upward trend.
Following a 3-day Advance, the price is estimated to grow further. Considering data from situations where SPY advanced for three days, in of 364 cases, the price rose further within the following month. The odds of a continued upward trend are .
SPY may jump back above the lower band and head toward the middle band. Traders may consider buying the stock or exploring call options.
Bearish Trend Analysis
The Stochastic Oscillator has been in the overbought zone for 1 day. Expect a price pull-back in the near future.
The 10-day moving average for SPY crossed bearishly below the 50-day moving average on November 24, 2025. This indicates that the trend has shifted lower and could be considered a sell signal. In of 13 past instances when the 10-day crossed below the 50-day, the stock continued to move higher over the following month. The odds of a continued downward trend are .
Following a 3-day decline, the stock is projected to fall further. Considering past instances where SPY declined for three days, the price rose further in of 62 cases within the following month. The odds of a continued downward trend are .
The Aroon Indicator for SPY entered a downward trend on November 28, 2025. This could indicate a strong downward move is ahead for the stock. Traders may want to consider selling the stock or buying put options.
Notable companies
Industry description
Market Cap
High and low price notable news
Volume
Fundamental Analysis Ratings
The average fundamental analysis ratings, where 1 is best and 100 is worst, are as follows

Advertisement
General Information
Category LargeBlend
Advertisement