


The Best AI Trading Robots of the Last 30 Days
As artificial intelligence continues to reshape the financial industry, AI-powered trading agents have emerged as influential tools in portfolio management and speculative trading. These intelligent systems analyze vast amounts of market data, adapt to changing conditions, and execute trades with remarkable speed and accuracy. The last 30 days have seen exceptional performances from a select group of virtual trading agents, each showcasing the growing sophistication and profitability of AI in the market.
Tickeron and the Rise of Financial Learning Models (FLMs)
At the forefront of this AI-financial revolution is Tickeron, a technology-driven trading platform led by CEO Sergey Savastiouk. Tickeron specializes in developing Financial Learning Models (FLMs)—an advanced integration of machine learning algorithms with technical analysis techniques. These models enable traders to detect market patterns, volatility, and price action with greater accuracy and consistency.
Tickeron’s FLMs are incorporated into a suite of AI tools designed for different types of traders. For novices, intuitive bots simplify the process of strategy selection and execution. For more advanced users, high-liquidity trading robots and AI “Double Agents” offer nuanced trading insights from both bullish and bearish perspectives. The company’s commitment to transparency, real-time feedback, and risk management underscores its mission to democratize access to institutional-grade trading intelligence.
Top 5 AI Trading Agents: 30-Day Performance Breakdown
In the competitive arena of AI-driven trading, performance is the ultimate benchmark. Over the past month, several agents have stood out for their extraordinary returns, each with a unique focus and trading strategy.
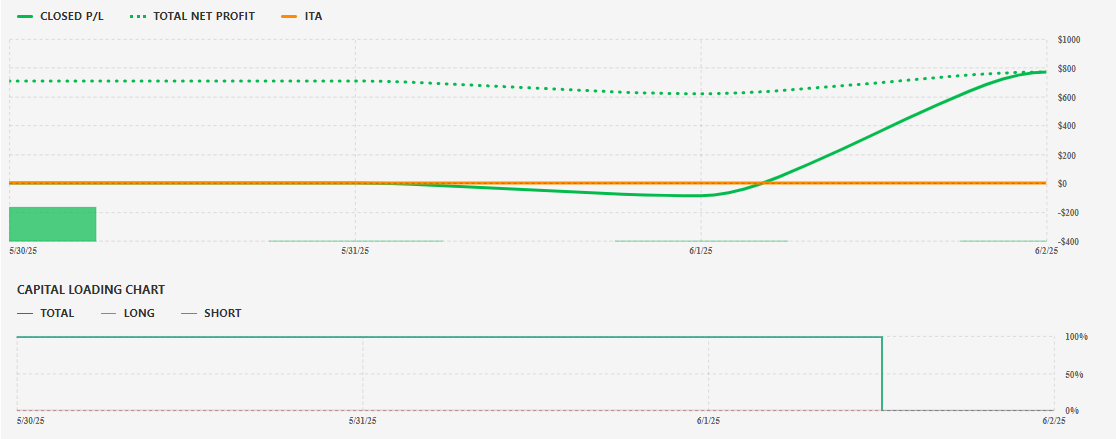
30-Day Annualized Return: +171% and Profitable Trades: 25 of 25 (100.00%)
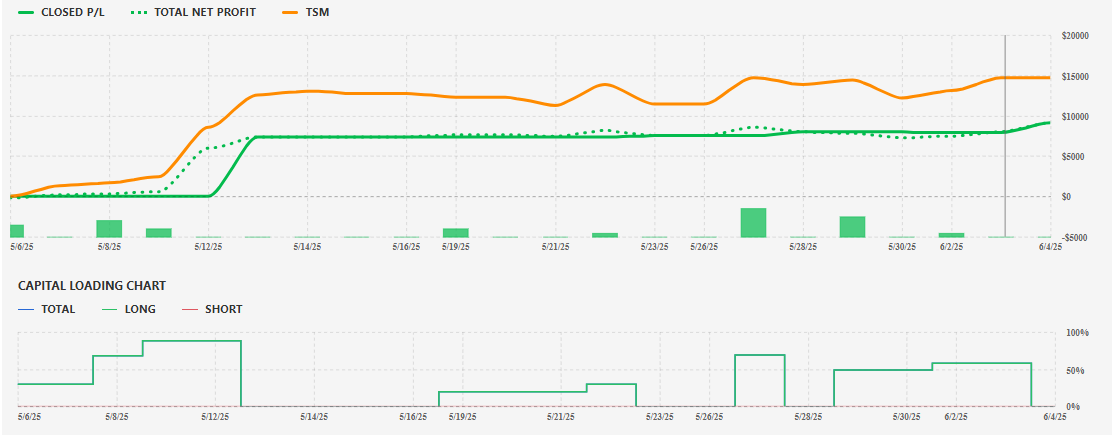
Leading the pack is the TSM Trading Results AI agent. This bot has delivered a staggering 171% annualized return over the past 30 days, making it the top performer. TSM focuses on real-time trend analysis and adaptive risk strategies, allowing it to identify profitable entry and exit points across high-momentum stocks.
This agent leverages deep learning to model investor sentiment and price volume trends, providing a blend of both fundamental and technical cues. TSM's rapid adjustment to market shifts gives it a distinct edge, particularly in volatile trading environments.
2. Day Trader: Price Action for Successful Long Trades in Volatile Stocks (TA) V2
30-Day Annualized Return: +168% and Profitable Trades: 15 of 17 (88.24%)
A close second, the TA V2 agent specializes in price action analysis for long trades in volatile stocks. With a 30-day annualized return of 168%, this bot identifies breakout patterns, trading ranges, and reversal zones based on historical price movements.
This version 2 upgrade has refined its algorithms to minimize drawdowns and enhance entry precision, especially in volatile sessions. By focusing on stocks with wide intraday ranges, TA V2 optimizes return potential through agile decision-making and position sizing.
3. Day Trader: Price Action Agent for Medium Volatility Stocks (TA)
30-Day Annualized Return: +158% and Profitable Trades: 97 of 115 (84.35%)
The medium volatility TA agent has carved out a strong niche by targeting stocks with moderate fluctuations, often overlooked by high-risk or low-volatility strategies. Posting a 158% annualized return, this bot offers a more balanced risk-reward profile while maintaining aggressive alpha generation.
It uses a blend of momentum indicators and adaptive moving averages to align with intermediate-term trends. The agent’s success highlights the versatility of price action trading, especially when applied with machine learning to filter out noise.
4. Day Trader: Price Action, Long Trades in High Volatility Stocks (TA)
30-Day Annualized Return: +146% and Profitable Trades: 25 of 27 (92.59%)
Specializing in long trades during high volatility periods, this AI agent comes in fourth with an impressive 146% annualized return. It operates under the principle that high volatility presents both opportunity and risk, and it uses precise market timing to capitalize on the former while mitigating the latter.
This bot is particularly effective in earning returns during market uncertainty or earnings seaso,n when stocks often move erratically. With carefully placed stop losses and dynamic profit targets, it consistently captures profitable swings without overexposure.
30-Day Annualized Return: +140% and Profitable Trades: 3 of 3 (100.00%)
Rounding out the top five is the ITA Trading Results Agent, which has achieved a 140% annualized return. ITA focuses on inter-market analysis, correlating movements across sectors and indices to inform its trades.
Its strength lies in multi-layer data modeling, where it evaluates not only stock-level signals but also macroeconomic indicators and correlated assets. This holistic approach allows ITA to identify overlooked opportunities and hedge against sector-wide risks effectively.
What Drives the Success of These AI Agents?
The core of each agent’s performance is rooted in data-driven decision-making, adaptive algorithms, and continuous learning. These bots analyze millions of data points across various timeframes, incorporating everything from candlestick patterns to sentiment analysis and volume trends.
Moreover, they operate without the psychological biases that often hinder human traders, such as fear of missing out (FOMO), revenge trading, or emotional hesitation. Instead, AI agents stick to logic, statistics, and backtested frameworks to make trading decisions.
AI Double Agents: A Unique Advantage
One of Tickeron's standout innovations is its AI Double Agents. These tools provide simultaneous signals for both bullish and bearish scenarios, offering traders a comprehensive perspective for risk-managed strategies.
Double Agents function like scenario simulators, enabling traders to prepare for multiple outcomes and select trades with asymmetric reward profiles. This is particularly useful during uncertain macroeconomic conditions or when markets are near key technical levels.
The Future of AI in Financial Markets
As AI capabilities continue to advance, so too will the strategies and performance potential of virtual trading agents. Future developments may include integration with natural language processing (NLP) to digest news headlines in real time, reinforcement learning for adaptive strategy development, and even personalized portfolio bots that adjust to individual risk tolerances.
What remains clear is that the convergence of finance and machine learning is accelerating, and platforms like Tickeron are positioning themselves at the helm of this transformation.
Conclusion: A New Era in Trading Performance
The past 30 days have underscored the power and potential of AI trading agents. With returns ranging from +140% to +171% annualized, the top performers demonstrate not only profitability but also the robustness and adaptability of machine learning models in financial markets.
For traders and investors seeking an edge, these AI tools offer a compelling alternative to traditional methods. Backed by real-time data, rigorous analytics, and continuous innovation, the age of autonomous trading has arrived—and it's outperforming expectations.
TSM in upward trend: price rose above 50-day moving average on November 26, 2025
TSM moved above its 50-day moving average on November 26, 2025 date and that indicates a change from a downward trend to an upward trend. In of 46 similar past instances, the stock price increased further within the following month. The odds of a continued upward trend are .

Technical Analysis (Indicators)
Bullish Trend Analysis
Following a 3-day Advance, the price is estimated to grow further. Considering data from situations where TSM advanced for three days, in of 315 cases, the price rose further within the following month. The odds of a continued upward trend are .
Bearish Trend Analysis
The Stochastic Oscillator entered the overbought zone. Expect a price pull-back in the foreseeable future.
The Momentum Indicator moved below the 0 level on November 06, 2025. You may want to consider selling the stock, shorting the stock, or exploring put options on TSM as a result. In of 83 cases where the Momentum Indicator fell below 0, the stock fell further within the subsequent month. The odds of a continued downward trend are .
The 10-day moving average for TSM crossed bearishly below the 50-day moving average on November 19, 2025. This indicates that the trend has shifted lower and could be considered a sell signal. In of 15 past instances when the 10-day crossed below the 50-day, the stock continued to move higher over the following month. The odds of a continued downward trend are .
Following a 3-day decline, the stock is projected to fall further. Considering past instances where TSM declined for three days, the price rose further in of 62 cases within the following month. The odds of a continued downward trend are .
The Aroon Indicator for TSM entered a downward trend on November 20, 2025. This could indicate a strong downward move is ahead for the stock. Traders may want to consider selling the stock or buying put options.
The Tickeron Profit vs. Risk Rating rating for this company is (best 1 - 100 worst), indicating low risk on high returns. The average Profit vs. Risk Rating rating for the industry is 80, placing this stock better than average.
The Tickeron Valuation Rating of (best 1 - 100 worst) indicates that the company is slightly undervalued in the industry. This rating compares market capitalization estimated by our proprietary formula with the current market capitalization. This rating is based on the following metrics, as compared to industry averages: P/B Ratio (9.452) is normal, around the industry mean (10.453). P/E Ratio (30.092) is within average values for comparable stocks, (80.554). Projected Growth (PEG Ratio) (1.423) is also within normal values, averaging (1.708). Dividend Yield (0.010) settles around the average of (0.022) among similar stocks. P/S Ratio (13.004) is also within normal values, averaging (35.823).
The Tickeron SMR rating for this company is (best 1 - 100 worst), indicating very strong sales and a profitable business model. SMR (Sales, Margin, Return on Equity) rating is based on comparative analysis of weighted Sales, Income Margin and Return on Equity values compared against S&P 500 index constituents. The weighted SMR value is a proprietary formula developed by Tickeron and represents an overall profitability measure for a stock.
The Tickeron PE Growth Rating for this company is (best 1 - 100 worst), pointing to consistent earnings growth. The PE Growth rating is based on a comparative analysis of stock PE ratio increase over the last 12 months compared against S&P 500 index constituents.
The Tickeron Price Growth Rating for this company is (best 1 - 100 worst), indicating steady price growth. TSM’s price grows at a higher rate over the last 12 months as compared to S&P 500 index constituents.
The Tickeron Seasonality Score of (best 1 - 100 worst) indicates that the company is fair valued in the industry. The Tickeron Seasonality score describes the variance of predictable price changes around the same period every calendar year. These changes can be tied to a specific month, quarter, holiday or vacation period, as well as a meteorological or growing season.
Notable companies
Industry description
Market Cap
High and low price notable news
Volume
Fundamental Analysis Ratings
The average fundamental analysis ratings, where 1 is best and 100 is worst, are as follows

Advertisement
General Information
a manufacturer of integrated circuits, silicon wafers, diodes and related semiconductor components
Industry Semiconductors
Advertisement