


Tickeron’s AI Delivers +152% Returns in KKR 5-Min Trading
Tickeron, a leader in AI-driven trading solutions, today announced exceptional results from its AI Trading Agent specialized in KKR stock. Achieving an annualized return of +152% on a 5-minute timeframe, this innovative tool empowers beginners and experts alike to navigate the complexities of trading one of the world’s largest alternative asset managers.
Press enter or click to view image in full size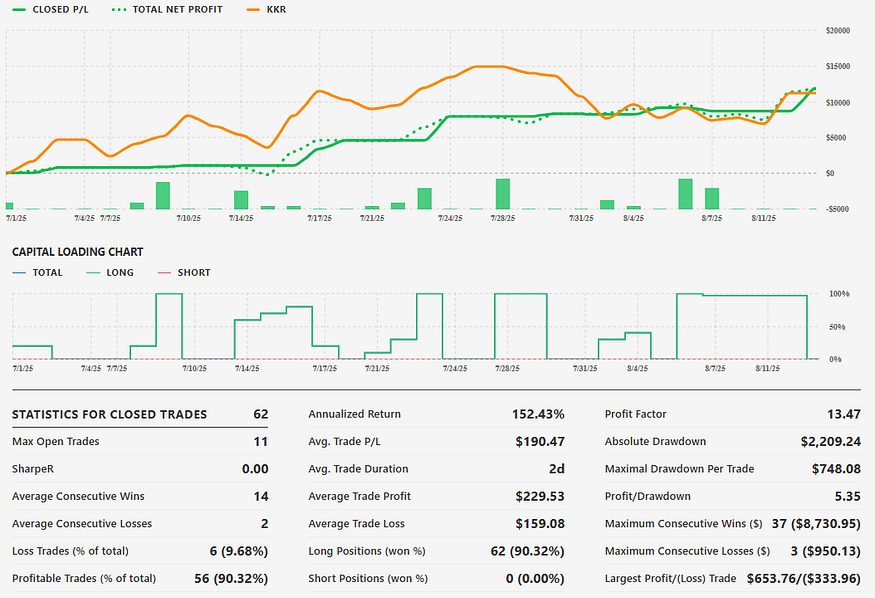
About KKR
KKR manages $624.4 billion in total assets, including $505.7 billion in fee-earning AUM as of September 2024. The firm operates through two core segments: asset management — encompassing private equity, credit, infrastructure, energy, real estate, and public markets — and insurance via Global Atlantic Financial Group, focusing on retirement, annuities, life insurance, and reinsurance.
AI Trading Agent Suitability
Designed for novice traders, the agent simplifies KKR stock analysis and execution by blending intraday (5-minute) and daily timeframes. It offers a structured, user-friendly experience, reducing emotional decision-making while building user confidence through automated insights.
5-Minute ML Overview and Strategic Features
Tickeron’s Financial Learning Models (FLMs) integrate AI with technical analysis to detect real-time bullish and bearish signals, enhancing transparency and efficiency. The agent employs 5-minute pattern recognition for entry signals, FLM-based trend filtering to minimize noise, and machine learning for optimized pattern detection. It adopts a smart swing trading strategy, confirming exits on daily charts, with automated risk management limiting open positions to six for stability.
Position and Risk Management
With medium volatility and a balanced profit-to-drawdown ratio, the agent excels in medium market conditions. Its low universe diversification score focuses on KKR to hedge sector risks, while high maximum open positions enable diversified exposure. AI-powered FLMs dynamically assess data, mitigating risks and maximizing gains in fast-moving markets.
Trading Dynamics and CEO Insights
Sergey Savastiouk, Ph.D., CEO of Tickeron, stated: “Through FLMs, we combine AI with technical analysis to help traders spot patterns accurately and manage volatility effectively. This KKR agent provides real-time insights, making high-liquidity stock trading accessible and controlled for all users.”
This breakthrough underscores Tickeron’s commitment to democratizing AI trading. For more details, visit Tickeron.com.
View AI Trading Robots: AI Trading for Stock Market | Tickeron
View Labor Day Sale: Beginners Sale
KKR in upward trend: price may ascend as a result of having broken its lower Bollinger Band on November 17, 2025
KKR may jump back above the lower band and head toward the middle band. Traders may consider buying the stock or exploring call options. In of 31 cases where KKR's price broke its lower Bollinger Band, its price rose further in the following month. The odds of a continued upward trend are .

Technical Analysis (Indicators)
Bullish Trend Analysis
The Stochastic Oscillator suggests the stock price trend may be in a reversal from a downward trend to an upward trend. of 59 cases where KKR's Stochastic Oscillator exited the oversold zone resulted in an increase in price. Tickeron's analysis proposes that the odds of a continued upward trend are .
The Moving Average Convergence Divergence (MACD) for KKR just turned positive on November 21, 2025. Looking at past instances where KKR's MACD turned positive, the stock continued to rise in of 42 cases over the following month. The odds of a continued upward trend are .
Following a 3-day Advance, the price is estimated to grow further. Considering data from situations where KKR advanced for three days, in of 348 cases, the price rose further within the following month. The odds of a continued upward trend are .
Bearish Trend Analysis
The Momentum Indicator moved below the 0 level on November 17, 2025. You may want to consider selling the stock, shorting the stock, or exploring put options on KKR as a result. In of 85 cases where the Momentum Indicator fell below 0, the stock fell further within the subsequent month. The odds of a continued downward trend are .
The 50-day moving average for KKR moved below the 200-day moving average on November 17, 2025. This could be a long-term bearish signal for the stock as the stock shifts to an downward trend.
Following a 3-day decline, the stock is projected to fall further. Considering past instances where KKR declined for three days, the price rose further in of 62 cases within the following month. The odds of a continued downward trend are .
The Aroon Indicator for KKR entered a downward trend on November 18, 2025. This could indicate a strong downward move is ahead for the stock. Traders may want to consider selling the stock or buying put options.
The Tickeron PE Growth Rating for this company is (best 1 - 100 worst), pointing to consistent earnings growth. The PE Growth rating is based on a comparative analysis of stock PE ratio increase over the last 12 months compared against S&P 500 index constituents.
The Tickeron Profit vs. Risk Rating rating for this company is (best 1 - 100 worst), indicating well-balanced risk and returns. The average Profit vs. Risk Rating rating for the industry is 73, placing this stock slightly better than average.
The Tickeron SMR rating for this company is (best 1 - 100 worst), indicating strong sales and a profitable business model. SMR (Sales, Margin, Return on Equity) rating is based on comparative analysis of weighted Sales, Income Margin and Return on Equity values compared against S&P 500 index constituents. The weighted SMR value is a proprietary formula developed by Tickeron and represents an overall profitability measure for a stock.
The Tickeron Price Growth Rating for this company is (best 1 - 100 worst), indicating fairly steady price growth. KKR’s price grows at a lower rate over the last 12 months as compared to S&P 500 index constituents.
The Tickeron Valuation Rating of (best 1 - 100 worst) indicates that the company is slightly overvalued in the industry. This rating compares market capitalization estimated by our proprietary formula with the current market capitalization. This rating is based on the following metrics, as compared to industry averages: P/B Ratio (3.959) is normal, around the industry mean (4.434). P/E Ratio (50.761) is within average values for comparable stocks, (29.719). Projected Growth (PEG Ratio) (0.493) is also within normal values, averaging (2.491). Dividend Yield (0.006) settles around the average of (0.081) among similar stocks. P/S Ratio (6.906) is also within normal values, averaging (21.649).
Notable companies
Industry description
Market Cap
High and low price notable news
Volume
Fundamental Analysis Ratings
The average fundamental analysis ratings, where 1 is best and 100 is worst, are as follows

Advertisement
General Information
a provider of investment management services to investors
Industry InvestmentManagers
Advertisement