FTBD Stock Tickeron detected bullish ETF Pattern: Broadening Bottom on April 07, 2025


at Tickeron.com


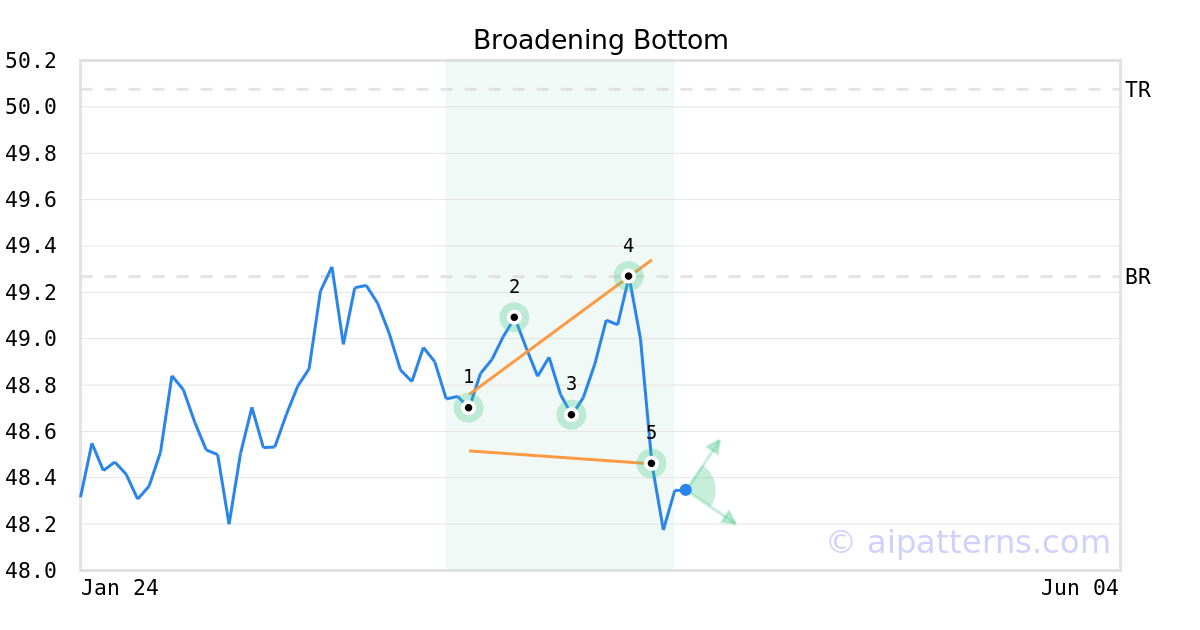
A.I.dvisor detected a bullish Broadening Bottom pattern for FTBD stock. This pattern was detected on April 07, 2025 . The odds of reaching the target price are 6.
The Broadening Bottom pattern is formed when the price of a security progressively makes higher highs (2, 4) and lower lows (1, 3, 5) following two widening trend lines.
Consider buying a security or call option at the upward breakout price/entry point.
Momentum Indicator for FTBD turns positive, indicating new upward trend
FTBD saw its Momentum Indicator move above the 0 level on November 24, 2025. This is an indication that the stock could be shifting in to a new upward move. Traders may want to consider buying the stock or buying call options. Tickeron's A.I.dvisor looked at 50 similar instances where the indicator turned positive. In of the 50 cases, the stock moved higher in the following days. The odds of a move higher are at .

Technical Analysis (Indicators)
Bullish Trend Analysis
The Moving Average Convergence Divergence (MACD) for FTBD just turned positive on November 25, 2025. Looking at past instances where FTBD's MACD turned positive, the stock continued to rise in of 25 cases over the following month. The odds of a continued upward trend are .
FTBD moved above its 50-day moving average on November 21, 2025 date and that indicates a change from a downward trend to an upward trend.
Following a 3-day Advance, the price is estimated to grow further. Considering data from situations where FTBD advanced for three days, in of 198 cases, the price rose further within the following month. The odds of a continued upward trend are .
The Aroon Indicator entered an Uptrend today. In of 144 cases where FTBD Aroon's Indicator entered an Uptrend, the price rose further within the following month. The odds of a continued Uptrend are .
Bearish Trend Analysis
The 10-day RSI Indicator for FTBD moved out of overbought territory on October 29, 2025. This could be a bearish sign for the stock. Traders may want to consider selling the stock or buying put options. Tickeron's A.I.dvisor looked at 21 similar instances where the indicator moved out of overbought territory. In of the 21 cases, the stock moved lower in the following days. This puts the odds of a move lower at .
The Stochastic Oscillator has been in the overbought zone for 2 days. Expect a price pull-back in the near future.
Following a 3-day decline, the stock is projected to fall further. Considering past instances where FTBD declined for three days, the price rose further in of 62 cases within the following month. The odds of a continued downward trend are .
Advertisement
General Information
Category MultisectorBond